
")
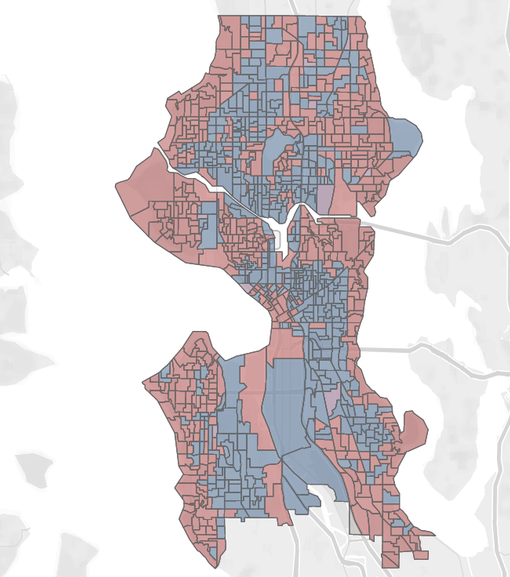
King County Elections finalized Primary Election results on Tuesday and Seattle’s data wizards quickly went to work conjuring maps showing precinct-level results. What emerged was a familiar pattern: left-wing candidates dominated in Seattle’s urban villages, the densest neighborhoods where much of the city’s growth has been funneled by zoning and land use policy.
Center-right candidates like former three-term City Councilmember Bruce Harrell and former Council aide Sara Nelson, on the other hand, dominated along the coasts, view corridors, and in Seattle’s sprawling single-family zones, where the share of renters is much smaller and average household incomes are much higher. Harrell ended up with 34.0% in the Seattle Mayor race and will square off with Council President Lorena González, who pulled in 32.1% in the left lane of the race. In the Seattle City Council Position 9 race, Nelson grabbed 39.5% of the Primary vote, but came up second to attorney, poet, organizer Nikkita Oliver, who won 40.2%, with a broad array of support and endorsements, including The Urbanist Election Committee’s.
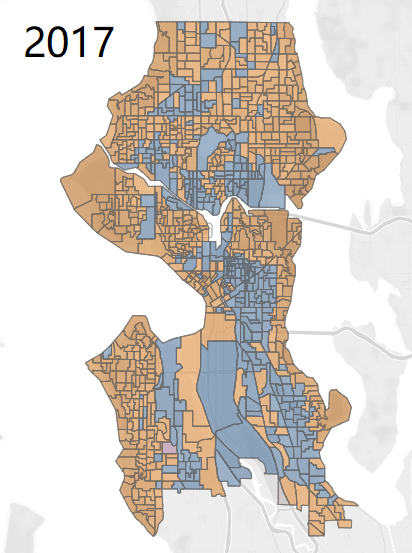
Those political fault lines worked out well for the centrist conservative-business coalition in the 2017 mayoral race. Jenny Durkan dominated in homeowner land and much of Downtown, where high-end condos and apartments prevail, and rode into office with a decisive 56.5% win over Urbanist-endorsed lefty Cary Moon. Bruce Harrell’s campaign has been very similar to Jenny Durkan’s, pledging steadiness and pro-business policies rather than progressive boldness and promising to crack down on crime and homeless encampments via removals.
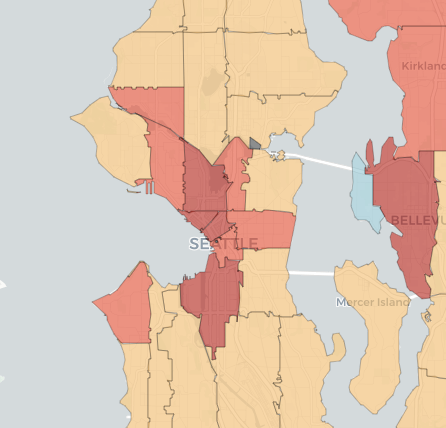
However, four more years of growth has continued to concentrate new residents in apartments in the city’s urban villages. In 2017, Seattle’s population had just crossed the 700,000 mark. Seattle’s population surpassed 761,100 in an April 2020 estimate from the Washington State Office of Financial Management — the U.S. Census Bureau’s 2020 official estimate was inexplicably lower at 737,015. Setting aside strange 2020 Census figures, Seattle has likely added at least 60,000 residents since 2017, and the vast majority (85% or more) of the growth is in urban villages and centers — not the single-family zones where centrists tend to rack up votes. The primary electorate increased in size in correspondence with the population gain: Seattle’s 2021 Primary attracted about 19,000 more ballots than the 2017 Primary, with turnout up slightly from 40.5% to 41.9%.

If those newcomers vote and vote with preferences similarly to the neighbors (both are big ifs) then that should be a big boost for progressive candidates. Even if newcomers don’t lean quite as left as their existing urban village residents, the fact that most are renters rather than homeowners could complicate the crafting of effective centrist appeals, which traditionally have spoken to core homeowner concerns.
A progressive renter-powered trend was on full display in 2019, when progressives bested centrist City Council candidates outside of Alex Pedersen’s narrow victory over socialist urbanist Shaun Scott. In fact, even in 2017, voters seemed to favor progressive City Council candidates even in an election Durkan dominated. In the citywide 2017 City Council races, centrist Nelson got pinched out of the primary by progressive Teresa Mosqueda and socialist Jon Grant and González easily dispensed with her challenger for a second term.
Voters appear happy with their pick in Mosqueda as she pulled in 59.4% in the 2021 primary. Councilmember Mosqueda’s map isn’t that illuminating beyond showing a thorough drubbing. When it comes to closer races, it seems pretty clear voters mostly stuck with the same progressive or centrist slate; the maps for Oliver and progressive City Attorney candidate Nicole Thomas-Kennedy are incredibly similar, and mostly similar to González’s map, except that Harrell (who used to be Southeast Seattle’s City Councilmember) made inroads in the Rainier Valley, particularly outside of urban villages, whereas Oliver dominated throughout and Thomas-Kennedy did lose some precincts to the incumbent Pete Holmes. (Shoutout to Jason Weill of Tableau for the lovely maps.)
The consolation for centrists: Downtown has been more of a mixed bag and contains the fastest growing neighborhoods in the city. Mayor Durkan had strength there in 2017, likely relying on higher income voters, and Harrell, Nelson, and Republican City Attorney candidate Ann Davison showed strength in some Downtown precincts, too. According to 2020 Census data, the fastest growing zip codes in Seattle over the past decade are in the Downtown core: 98134 (SoDo) leads the way 88.8% growth, 98121 (Belltown) is next with 69% growth, followed by 98109 (South Lake Union, Uptown, and Westlake) at 69%, and 98101 (Downtown) at 59%.
Many are predicting tight races for Seattle Mayor and the open Seattle City Council seat. The progressive coalition’s stronger appeal to renters should give them a sizable advantage in the long-term as Seattle grows primarily by adding apartments. But will it be enough to carry the day in 2021?
Housing advocates and progressive leaders have argued that single-family zoning consuming 75% of Seattle’s residential land is inequitable and unfair to Black, Indigenous, and people of color (BIPOC) who are increasingly rent-burdened and at risk of being displaced out of the city, if they haven’t been already, after having been denied wealth-building opportunities and the opportunity to own homes for much of Seattle’s history. Eliminating exclusionary zoning is the right thing to do and the progressive policy choice. The slider map below shows how closely voting patterns are linked to zoning.


Exclusionary zoning breeds exclusionary politics. One symptom is that many see removing and punishing homeless people as a higher priority that solving the root causes of our homelessness crisis. While the opioid crisis and our patchwork mental health system steals much of the attention, our expensive and rapidly rising housing prices are clearly a major factor driving homelessness. And the insistence in keeping 30 square miles of Seattle gated off for single family homes only is clearly only adding to the housing crisis, driving up housing prices, and denying housing options to younger generations of the working class.
This election both reflects housing and wealth inequality and is very much about solutions to it. González, Oliver, and Mosqueda have stressed that ending exclusionary zoning and investing big time in social housing is a priority and a moral imperative. Benefitting from the status quo, Harrell and Nelson have declined to make such commitments, preferring to keep plans exploratory and vague — and let the data continue to pile up. But since the data in this case is people financially wrecked and pushed out of Seattle by our inequitable housing system, delay comes at a big cost.

Doug Trumm is publisher of The Urbanist. An Urbanist writer since 2015, he dreams of pedestrianizing streets, blanketing the city in bus lanes, and unleashing a mass timber building spree to end the affordable housing shortage and avert our coming climate catastrophe. He graduated from the Evans School of Public Policy and Governance at the University of Washington in 2019. He lives in East Fremont and loves to explore the city on his bike.