

Let’s try to build a picture of King County’s waste issues.
For the last couple of weeks, I have been working on an article about the Seattle and King County wastewater and solid waste systems. That’s a combination of sewage and garbage and recycling and compost, all the stuff that leaves our homes as waste.
What I’ve found is that we have a system that works acceptably for right now. There’s a handful of caveats to that sentence. Acceptably means that our waste systems function within the bounds of applicable law and regulation. Some parts do great, others not as much, but nothing egregiously illegal seems to be going on. Right now means literally right now. These systems do not deal at all with a long history of mismanagement and are not prepared for systemic shocks coming in the future.
But that article is for the coming weeks. Today we have to talk about what our waste system actually looks like.
That’s a problem. Once waste leaves our homes, it gets shuttled to varied corners of the county and out of state on different tracts. Sewage leaves as pipes. Different flavors of solid waste leave in different colored trucks. Some return as resources. Often the waste gets buried somewhere. Different agencies deal with each component of the waste cycle separately.
As part of justifying their existence, many agencies create diagrams of their section of the process. They simplify down elaborate systems to a series of icons so they’re easily understood by the most people. Diagrams are abstractions of real world complexity. Here’s a sample from local water, wastewater, and electricity service providers:
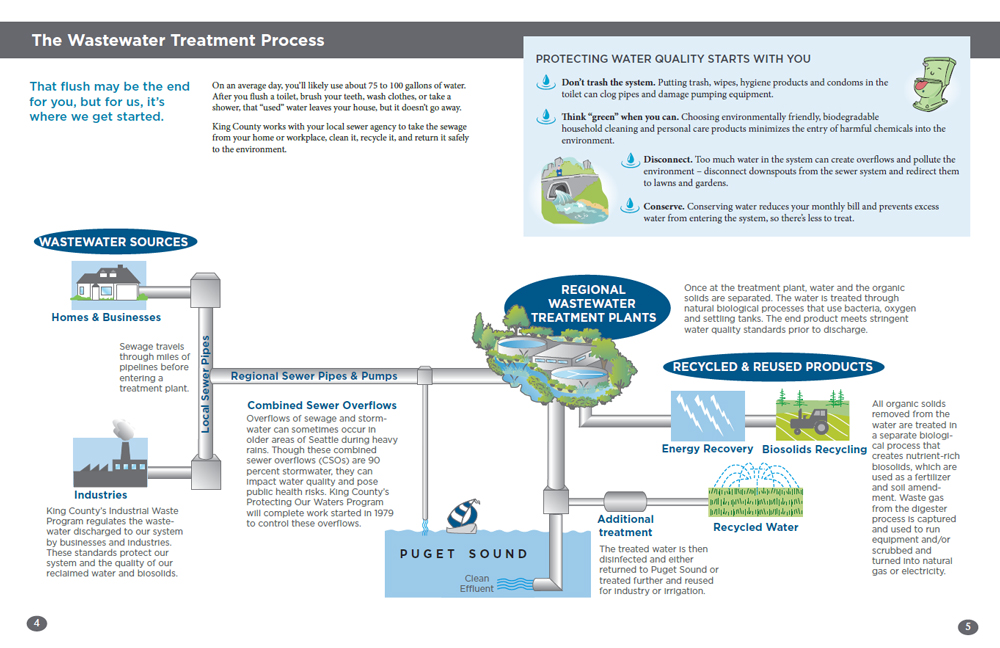
King County Wastewater Treatment Process. 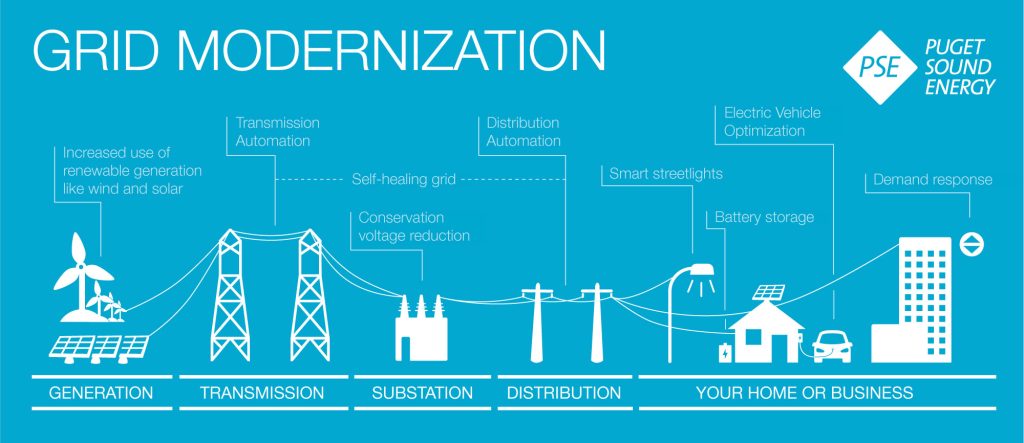
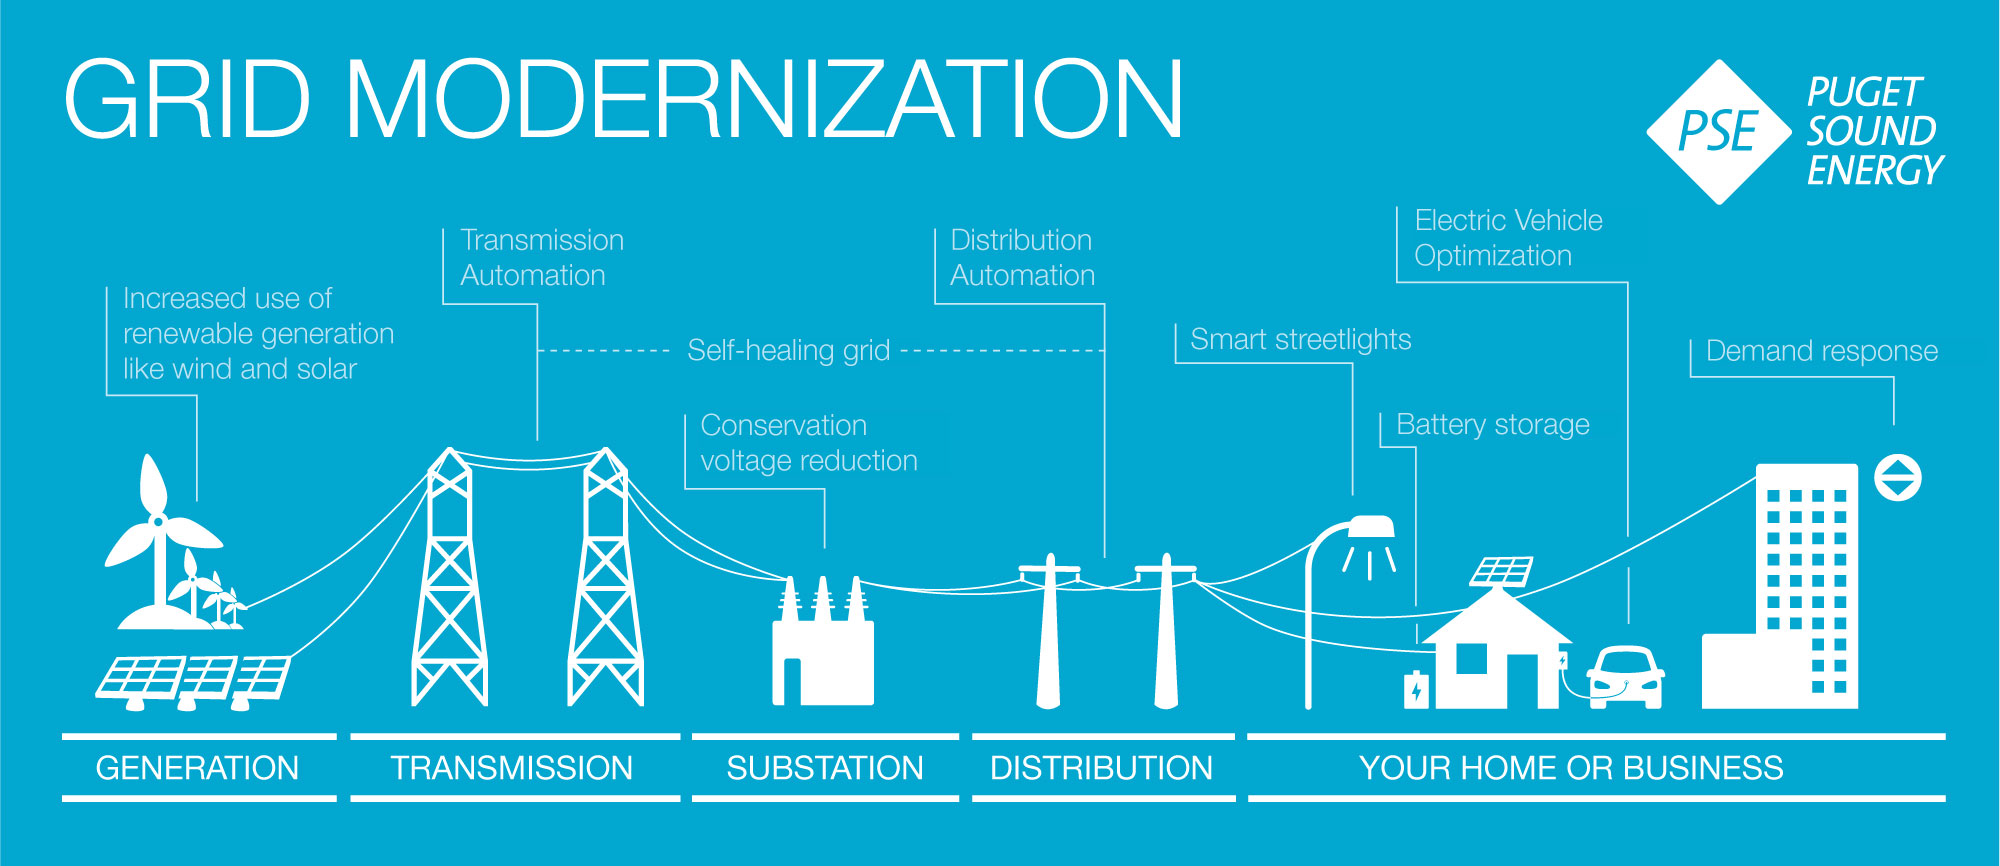
Grid Modernization (Puget Sound Energy) 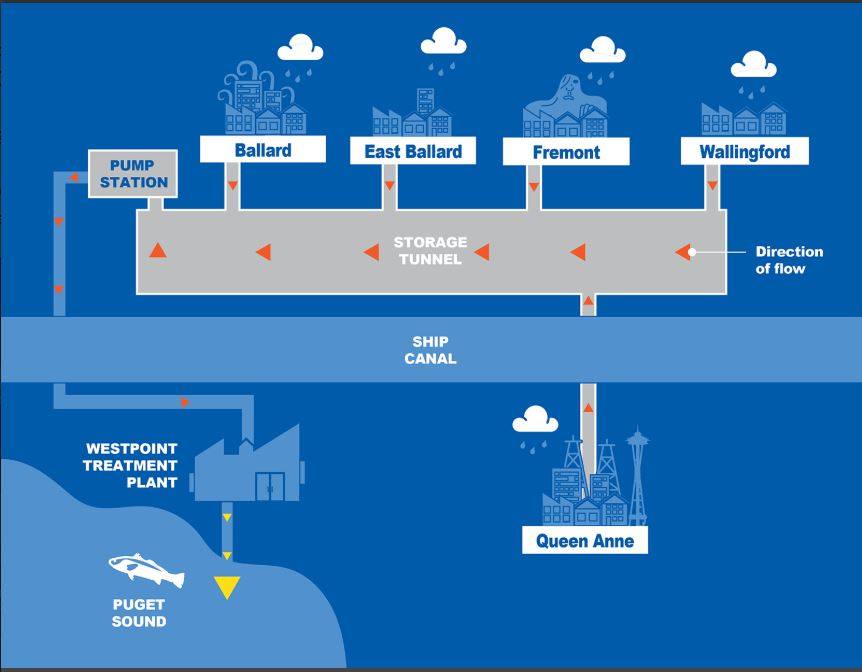
Ship Canal Water Quality Project Diagram (Seattle Public Utilities) 
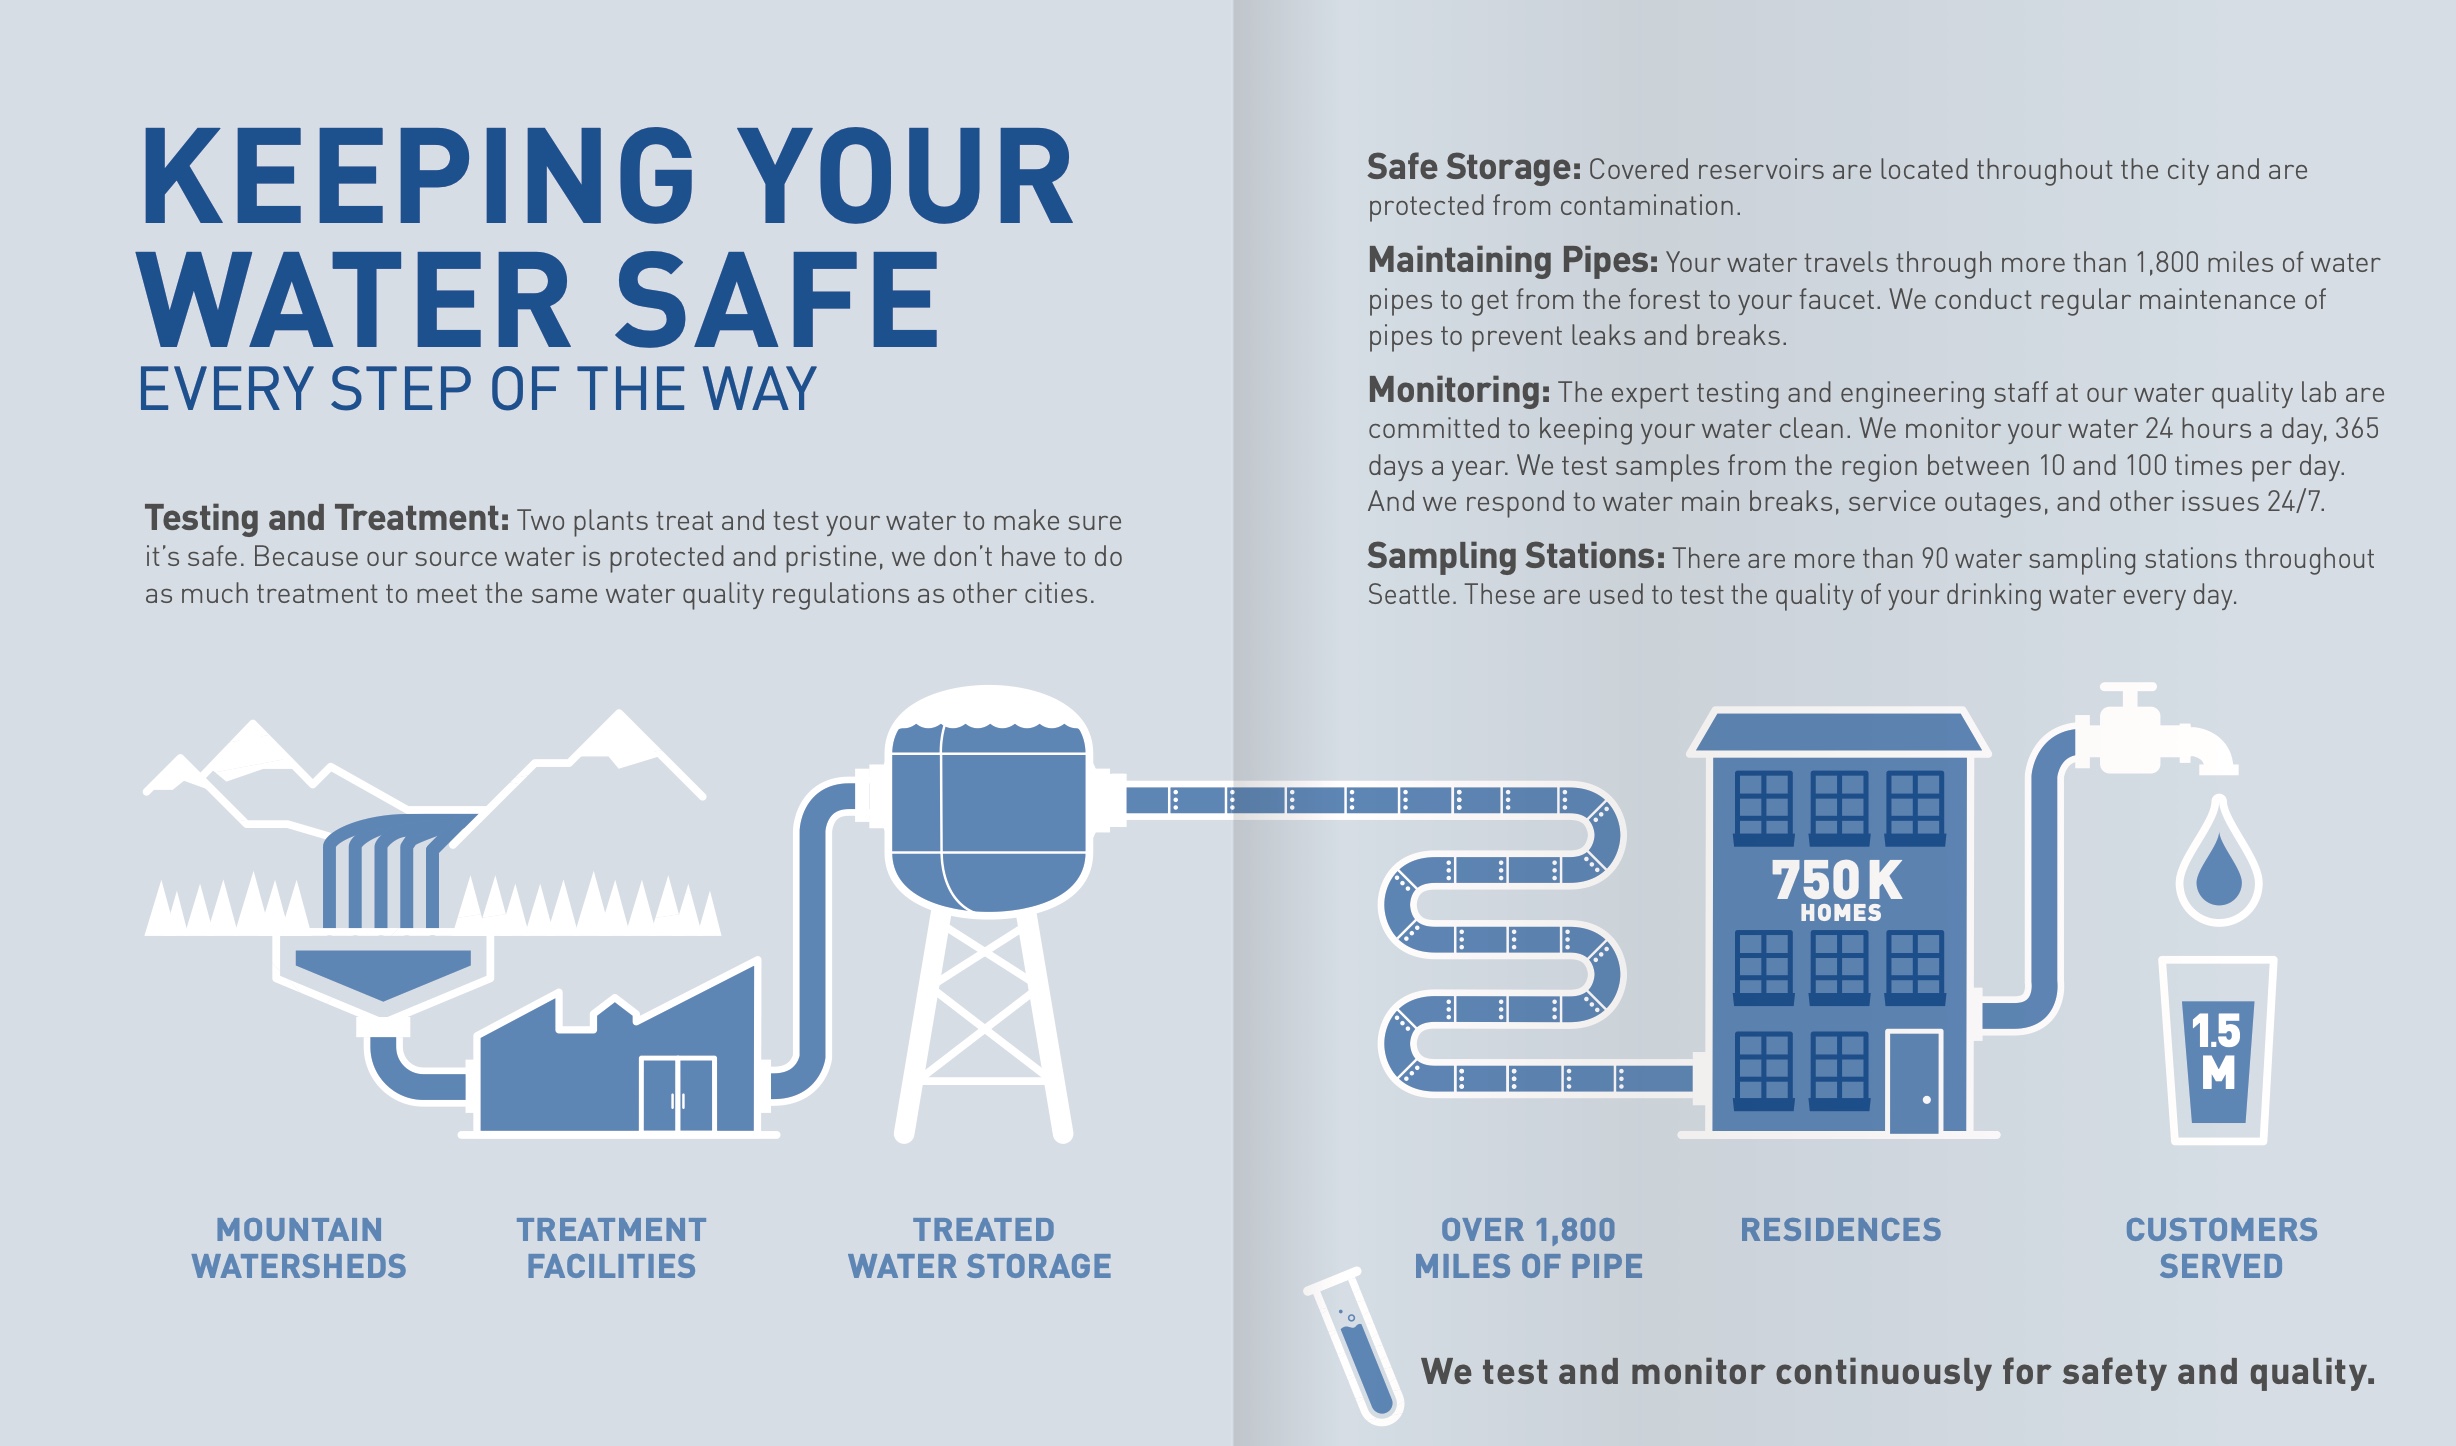
Keeping Your Water Safe Diagram (Seattle Public Utilities) 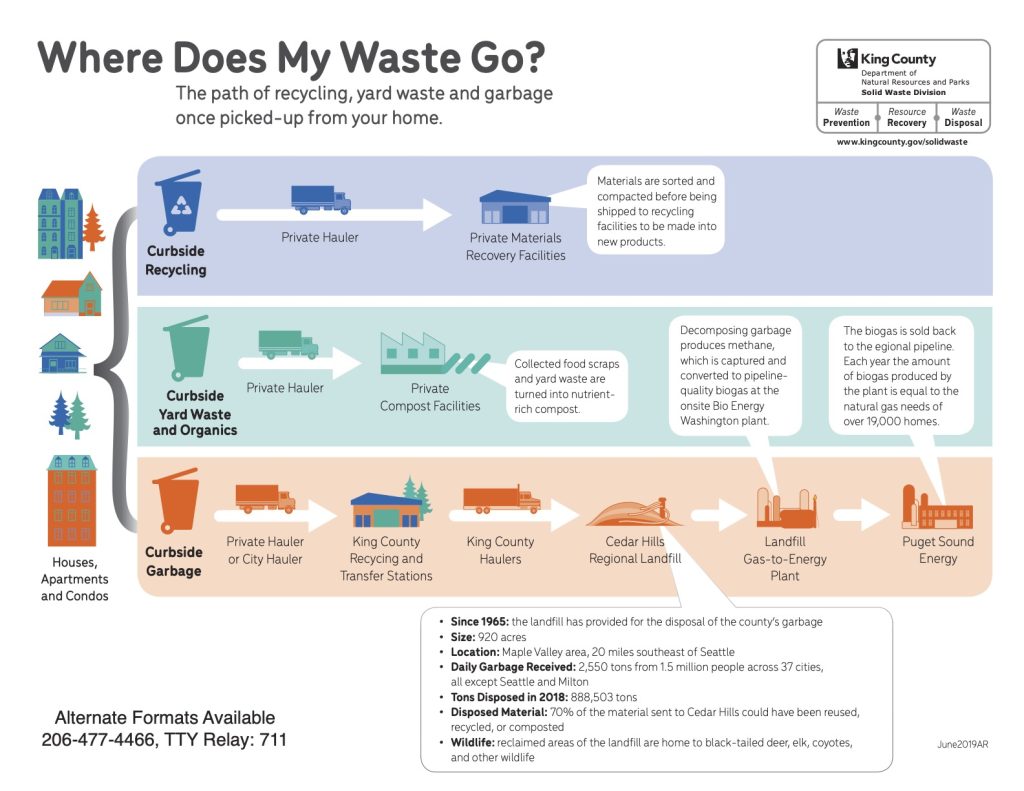
Where Does My Waste Go? (King County Solid Waste Management)

Each diagram starts or ends at a home. Rarely do we ever see the outputs of these processes wrap back around to produce new materials or combine various parts of the waste/recovery system into one larger picture. One that comes closest is a diagram from King County’s 2019 Solid Waste Management Plan. It shows waste leaving the home heading to its various destinations, then returning to the community as recycled material, compost, or other recovered resources. It’s a really well done diagram.
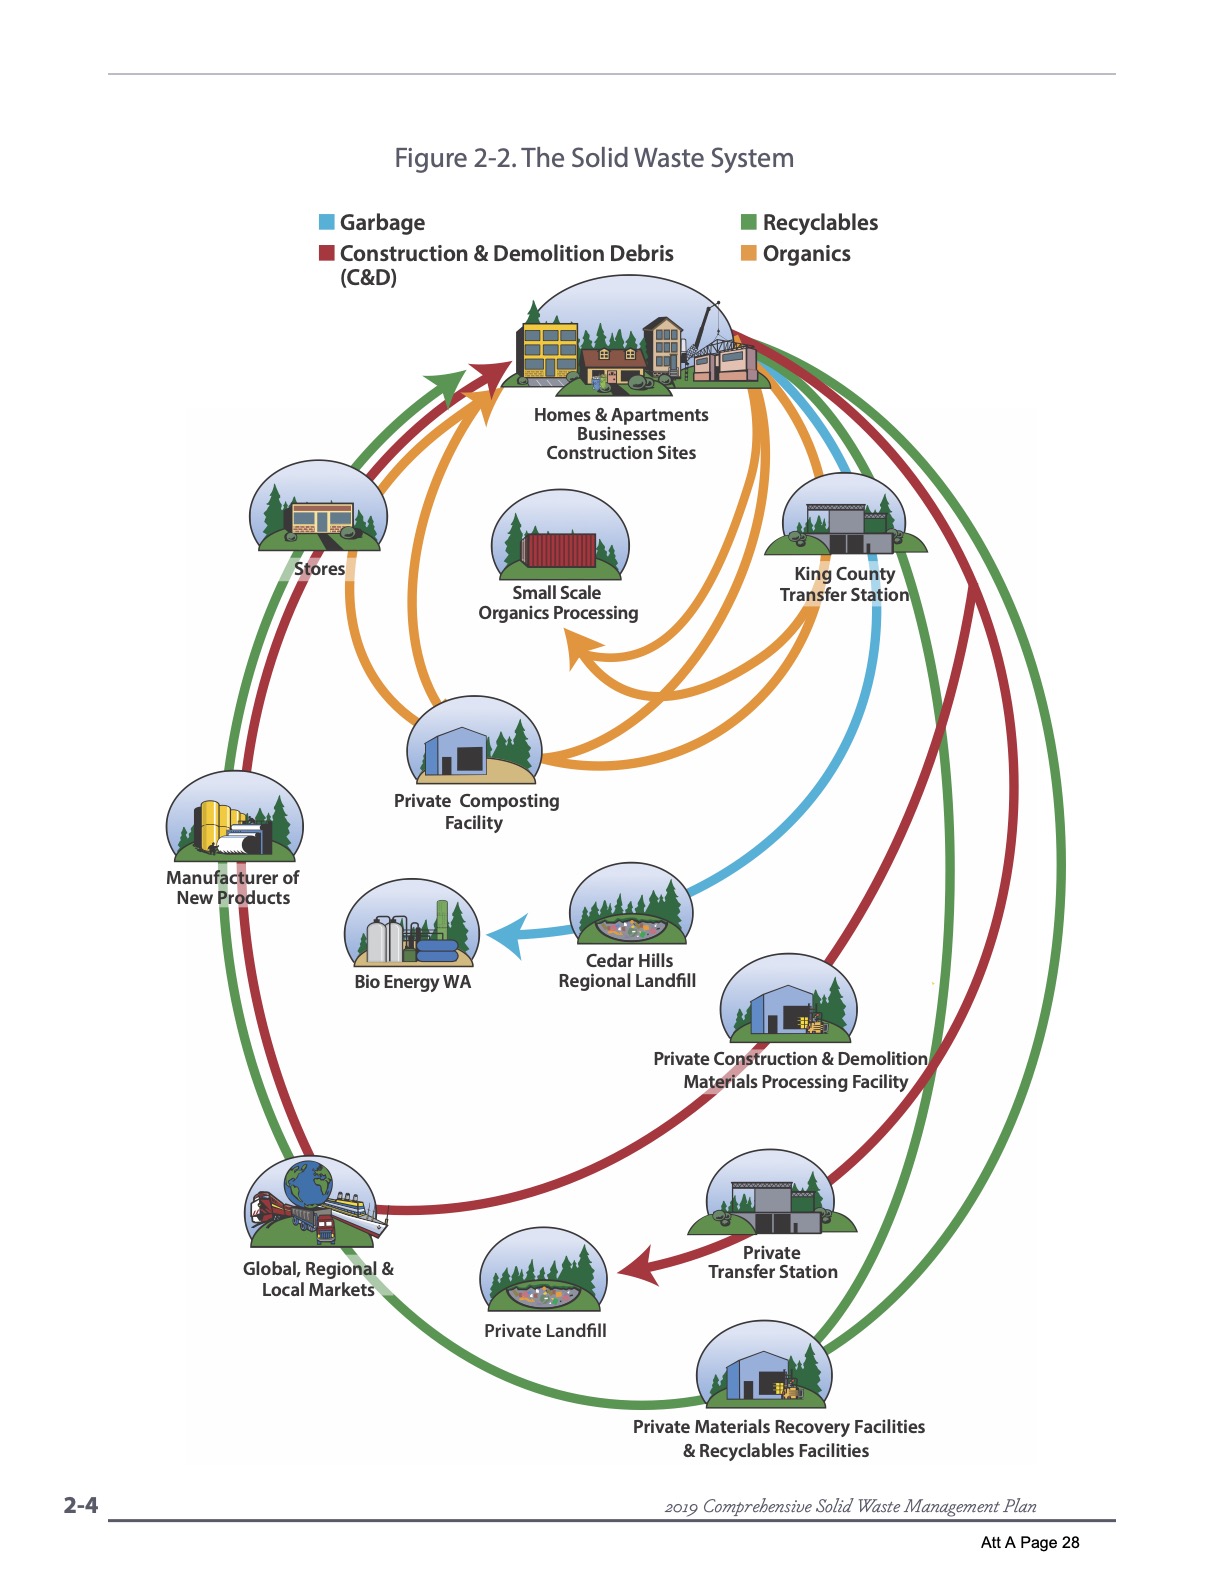
Yet even this diagram omits a lot of the waste that leaves the home, specifically sewage. It also skips places where these processes commingle. Let’s try to do better.
Unified Diagram of Waste
From here on out, we’re going to flip through a series of images trying to build up to a complete, if still simplified, diagram of the waste inputs and outputs in King County. There is some variation throughout the county, with individual jurisdictions sending waste to other places or joining independent wastewater treatment districts. I’ll note it where possible, but we’re trying to keep an eye on the bigger picture.
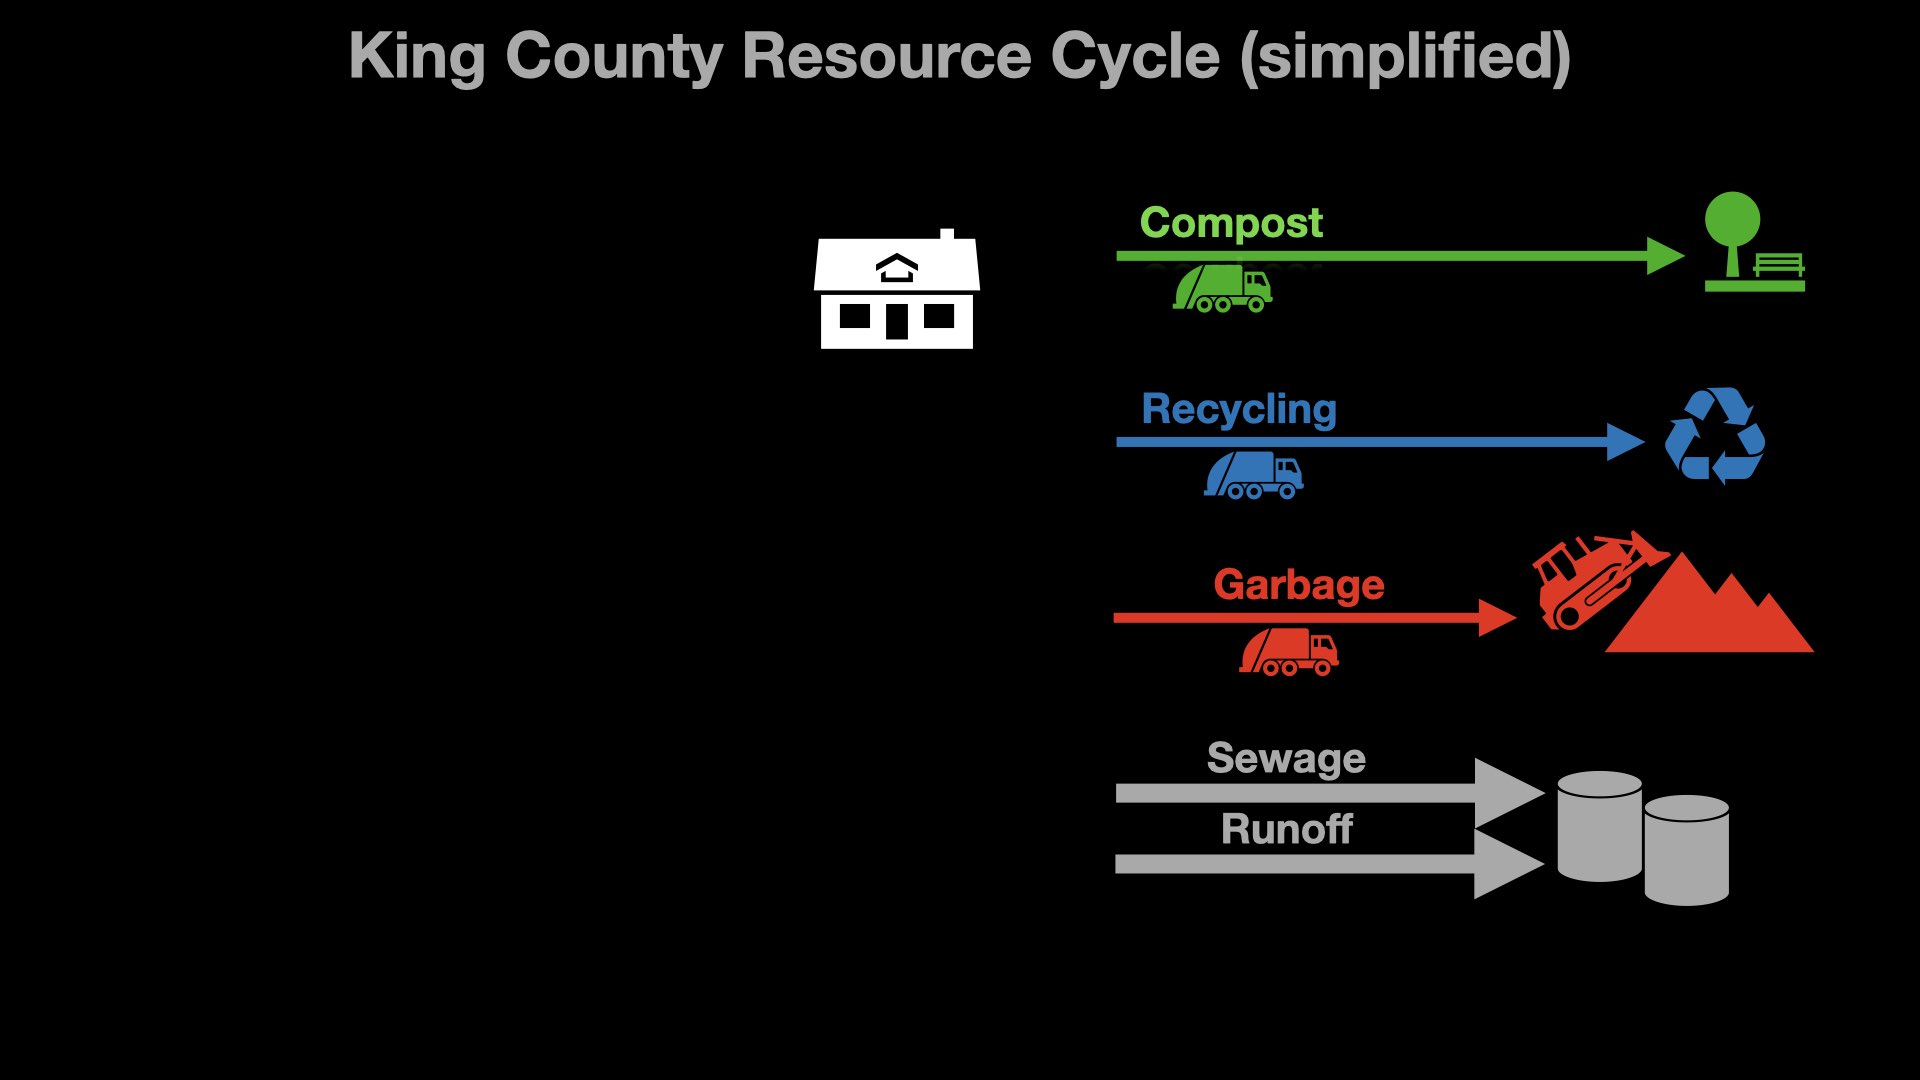
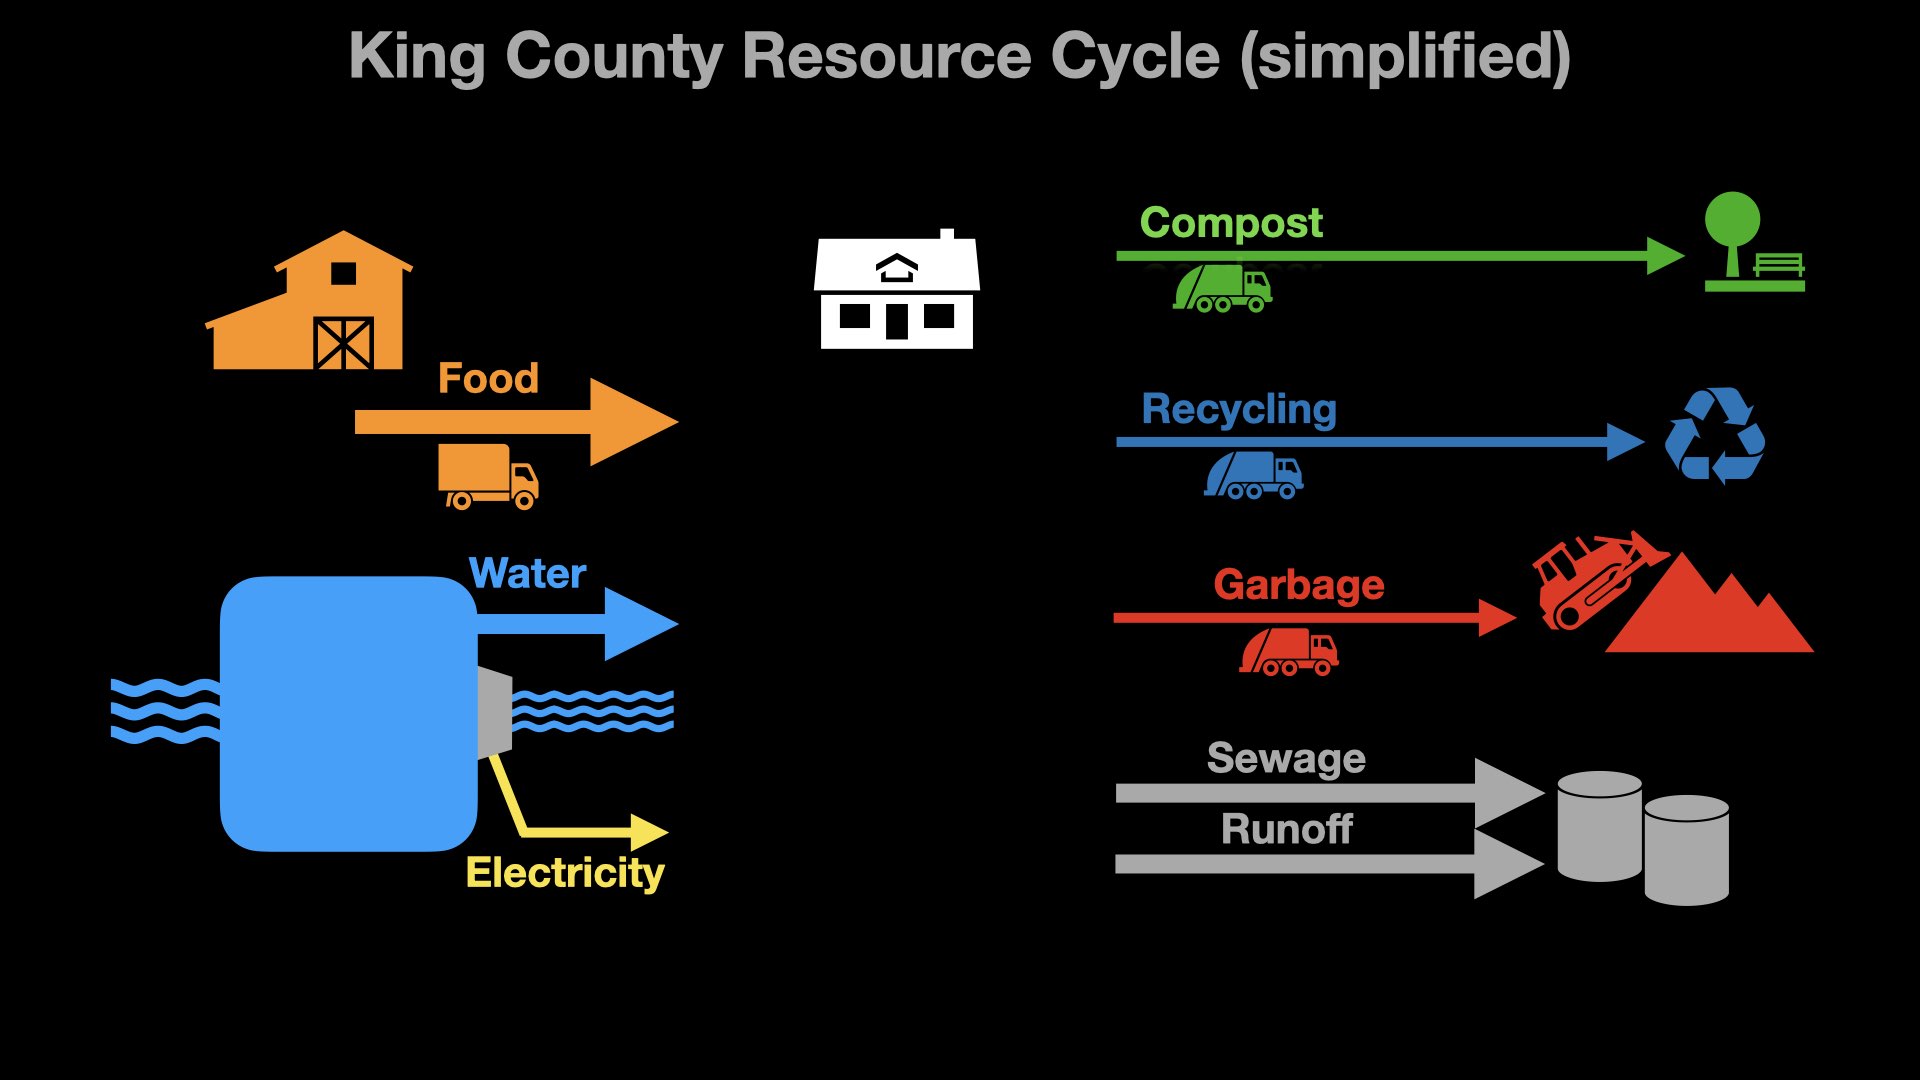
We can start with the basics: a house and the four routes used to move waste away. Now, I do not live in a house that looks like this, but the diagram is going to get busy, so let’s keep it simple. Solid waste–compost, recycling, and garbage–are taken by truck to various public and private transfer stations. Compost goes to Cedar Grove, a private composting facility. Recycling is handled by private firms. Garbage goes to landfills: Seattle by train to Columbia Ridge Landfill in Oregon; King County by truck to Cedar Hills Landfill. Sewage is carried by pipe to a regional wastewater treatment plants, three operated by King County or three others operated by smaller sanitation districts. Much of Seattle relies on a system that also carries stormwater through the same pipes. That’s why a subway tunnel sized cistern is being drilled under Ballard and Fremont right now.
Let’s now add some facilities on the left side of the diagram, inputs to the home. For most of Western Washington, water and electricity come from similar sources: mountain rivers and lakes. While there are reservoirs in the city, they are fed from the Cedar River and Tolt Reservoir in the Cascades. Other lakes are dammed to produce our regional electricity supply. Of course, we need to supply something for all that sewage (ew), so let’s put our state’s wildly successful agricultural industry as an input also. EAT APPLES.
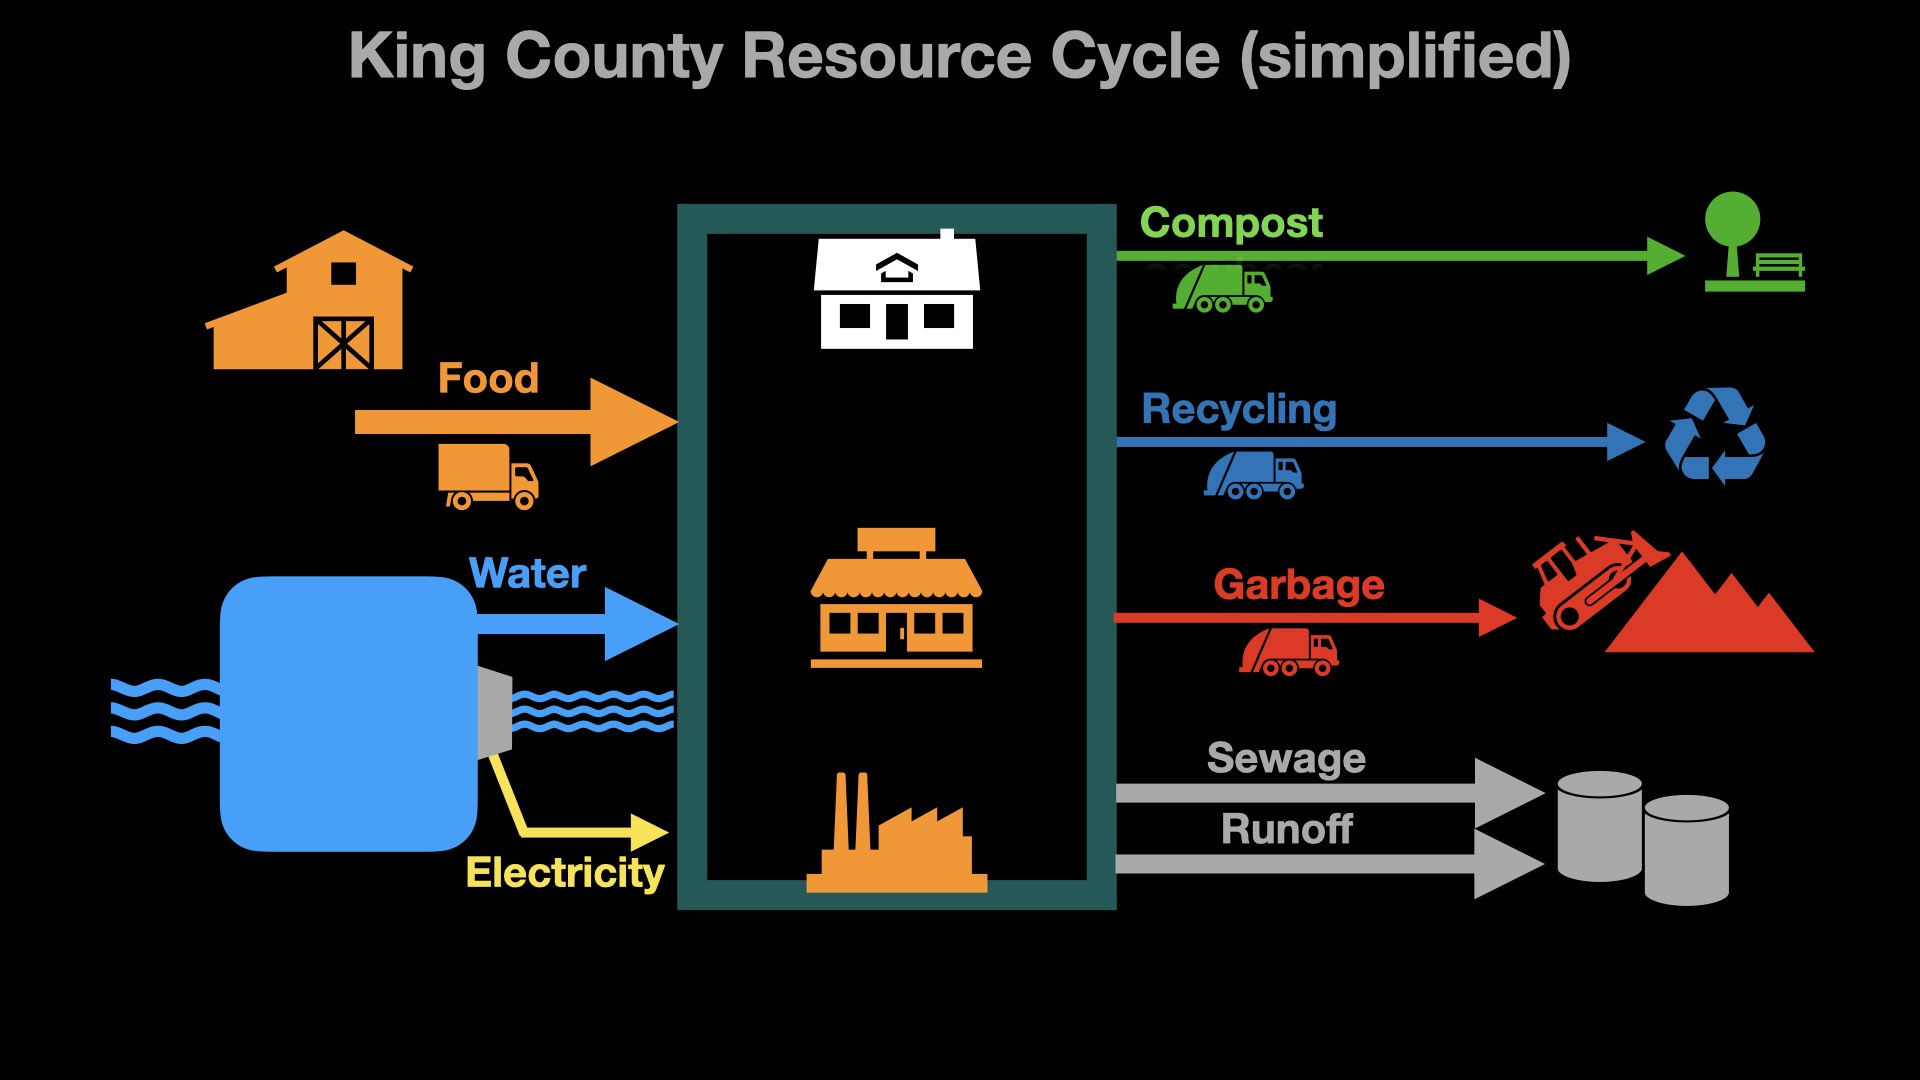
To finalize the basic layout of inputs and outputs, let’s recognize that this house isn’t standing here alone in a field. We’re part of a city with stores and employers. In some ways, the city shelters us from the nitty gritty of these utilities. Inside the box, we can flush the toilet and roll out the trash cans with little extra thought.
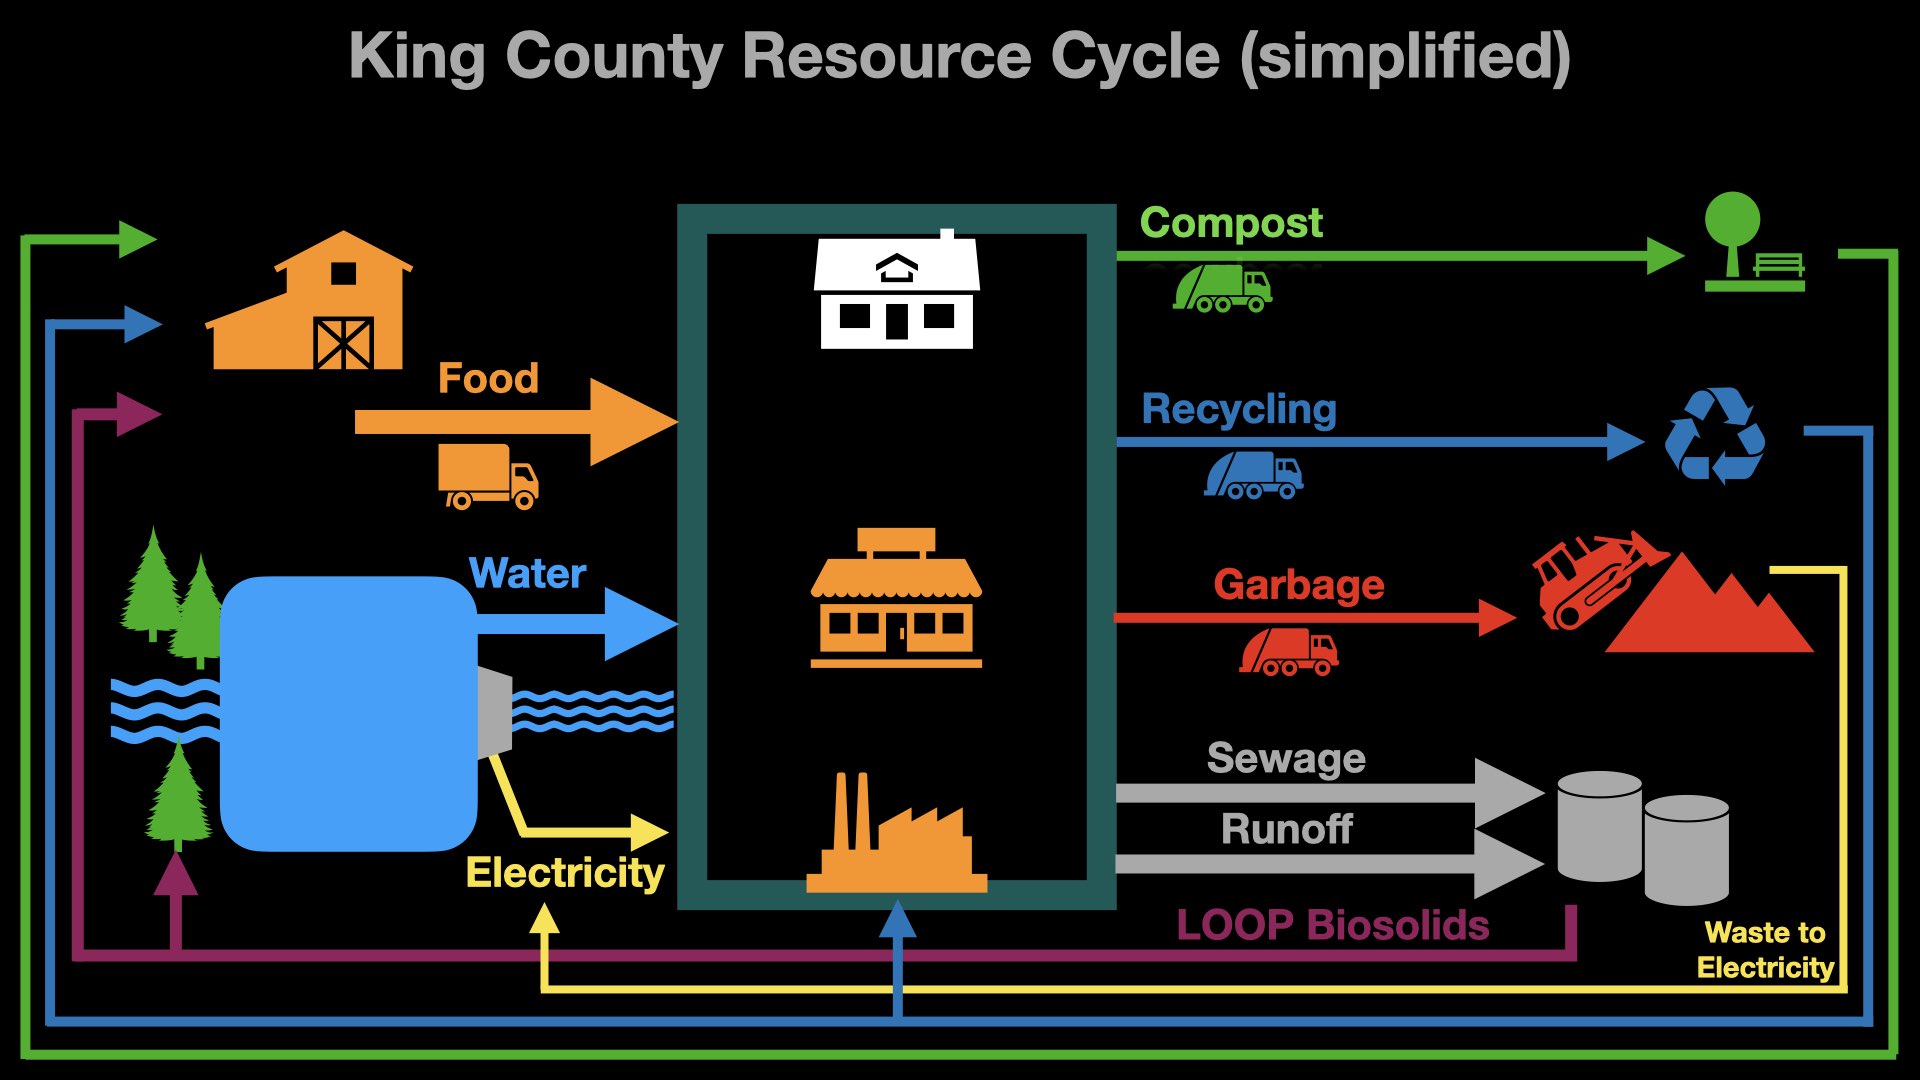
This is a cycle diagram, so let’s add some cycles. Each of the four outputs has some component that comes back around as an input. The compost and recycling streams return as soil amendments on farms or new products in factories and stores. King County wastewater treatment plants produce LOOP Biosolids, a fertilizer that is used on agriculture lands in Eastern Washington and state forests. Cedar Hills Landfill hosts a plant that captures escaping methane gases produced as the existing garbage decomposes. This comes back to the grid as electricity. Biogas is also produced at wastewater treatment plants, but is mostly used onsite.
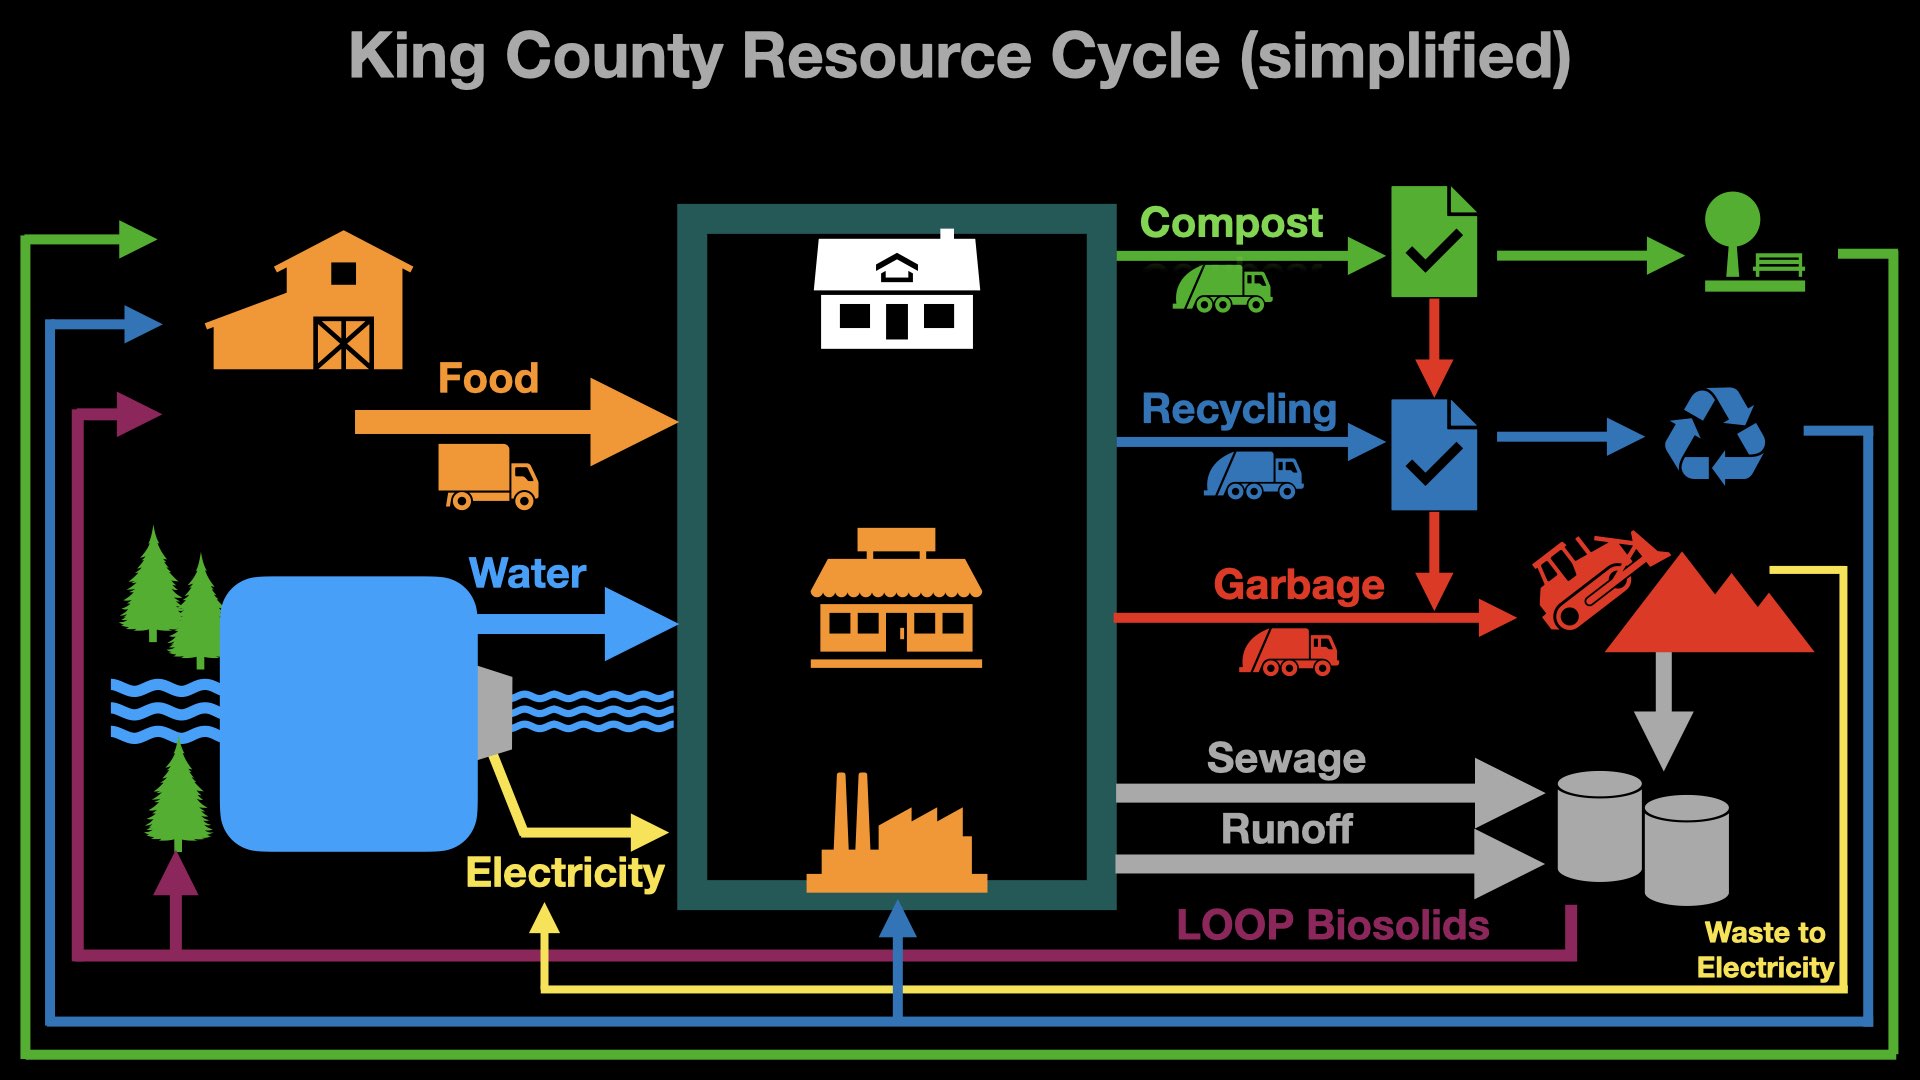
Now here’s where things get rough, and we have to add some arrows between the outputs on the right. Compost and recycling do not automatically make it to their final destinations for processing into something new. Each facility has standards which may reject soiled or contaminated material. Rejected material goes to landfills. The landfill itself also produces wastewater. Cedar Hills has a permit to produce 2.7 million gallons of wastewater per day and send it along to the South Treatment Plant in Renton. In 2019, the last year that numbers are available, the landfill exceeded that volume once. The landfill also produced “multiple exceedances” of its permitted load of arsenic.
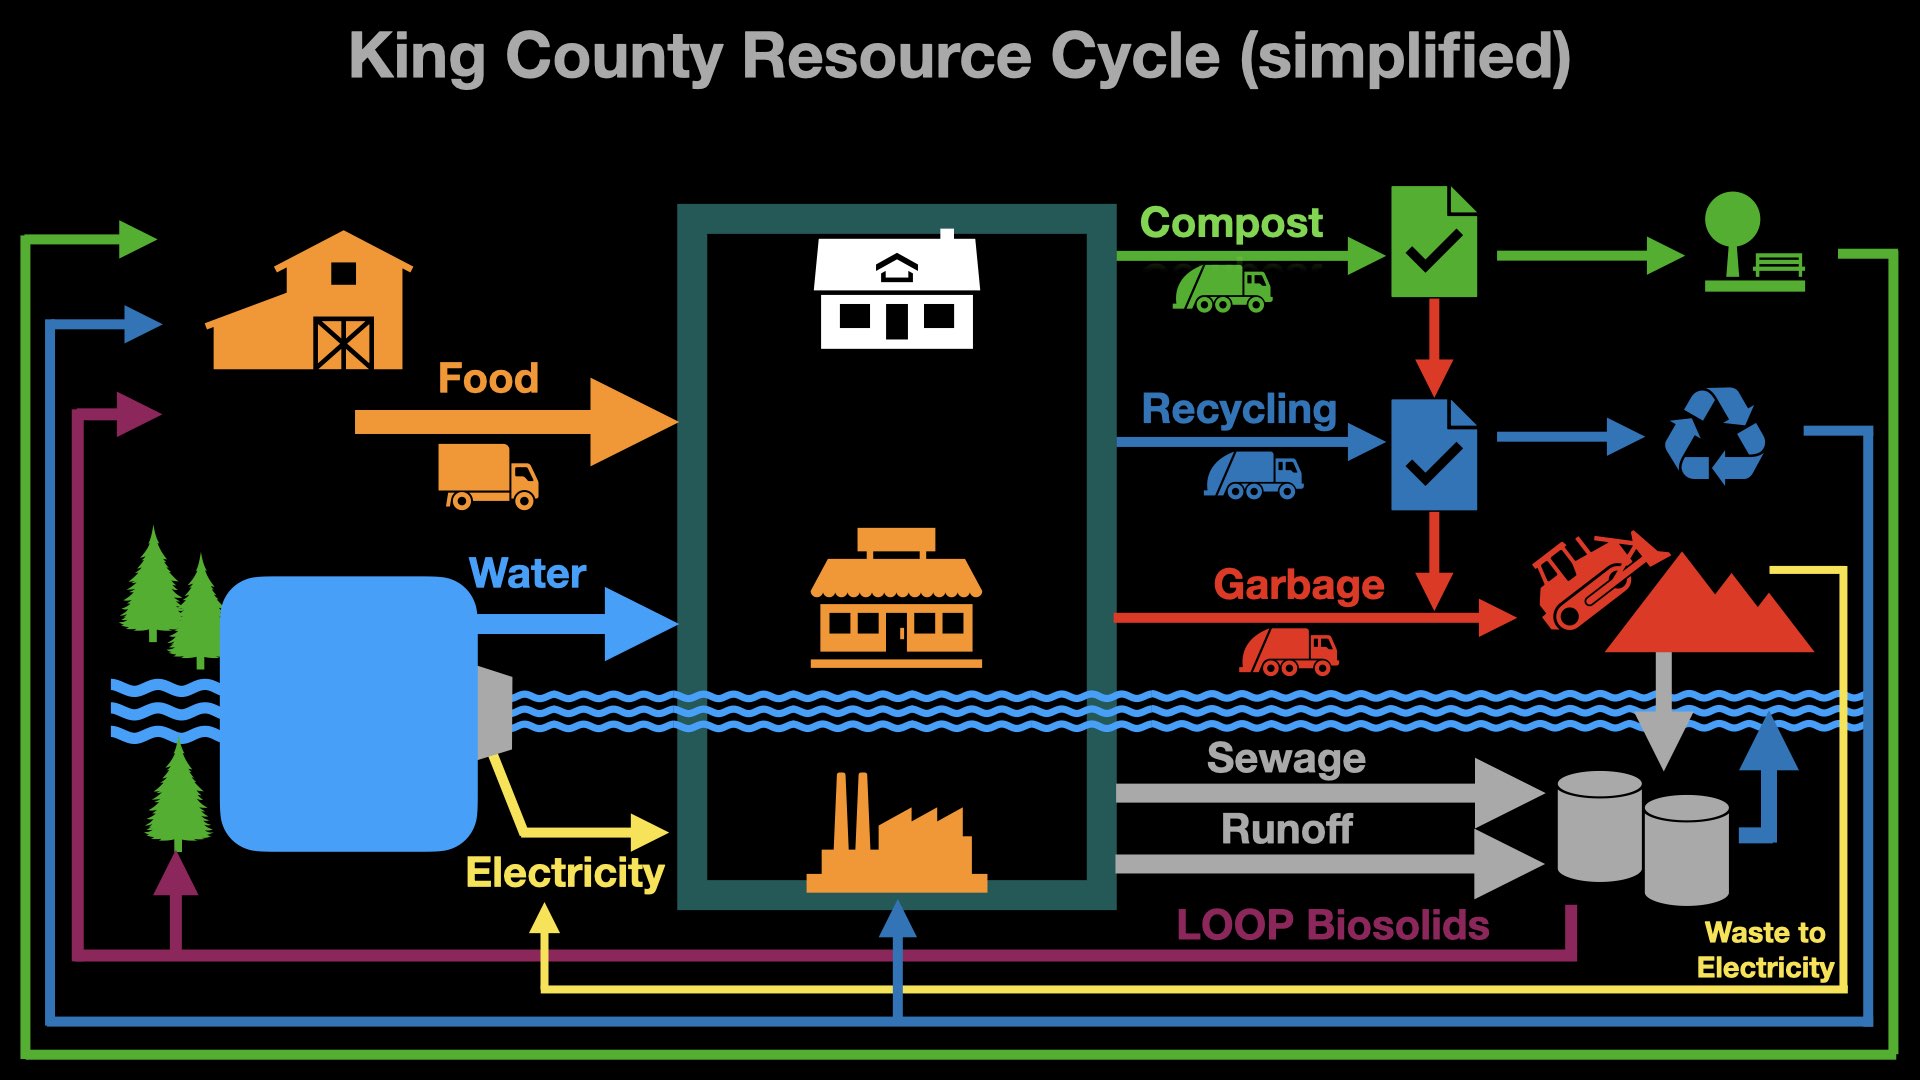
One last very important connection between these facilities. Let’s extend that water coming out of the mountains, through developed land, and meeting the discharges of the wastewater treatment plants. Federal and state law requires that the discharges meet stringent requirements for removal of contaminates. Reports from these agencies show that King County’s facilities meet or exceed the legal requirements. The arrow here is not to suggest malfeasance. It’s to show how that discharge sits at the precarious end of a complex and interconnected network. Heavy rain or a power flicker will overflow the treatment plants and put untreated sewage into local waterways, as happened this week.
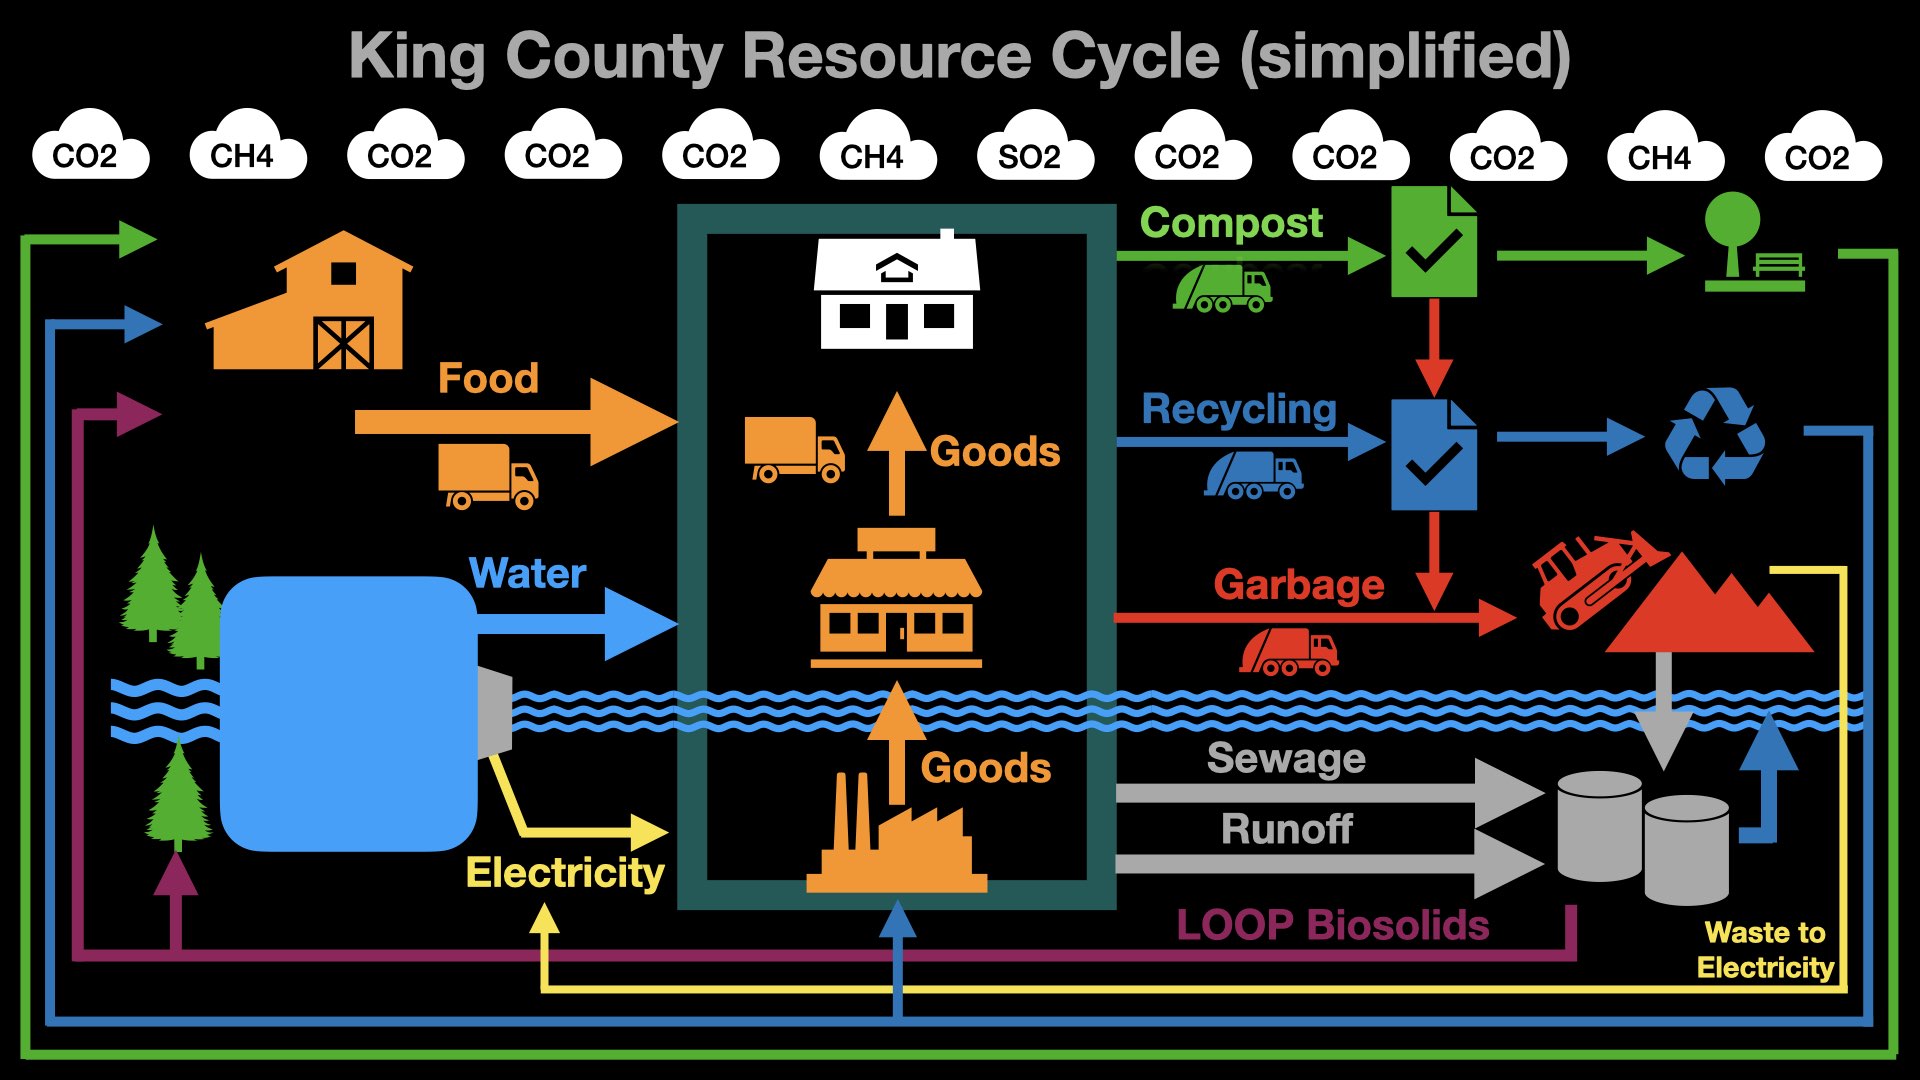
And, finally, it should be noted that every stage of this process produces greenhouse gases and pollutants. We can add some clouds of carbon dioxide (CO2), methane (CH4), and sulfur dioxide (SO2). The reliance of this system on trucks to transfer materials is a primary contributor of greenhouse gases. And we can add the intra-city movement of goods by truck. Other contributions include decay of materials in the landfill, breakdown of sewage in the treatment and composting process, and reformation of recycled material into new goods. Some of this is captured for waste-to-energy or offset by fertilizing new forests. But nothing can offset the immense transportation infrastructure that goes into waste hauling and disposal.
This diagram has some significant gaps. First, there’s not a measure of proportionality. By weight, as much material goes into the landfill as are recycled and composted combined. Also, the amount of electricity produced by Cedar Hills powers about 19,000 homes, or a little less than 2% of the homes in King County. And there are significant questions about the volume of material actually being recycled. A proportional diagram would scale up images and arrows to reflect this concepts.
Second, while we show some goods made here, not a lot of retail stuff is made in King County. Most of the goods coming into the city are made somewhere else, carrying the load of transport and that locality’s energy production with them. The same with recyclables, energy, and the bulk of our food. That makes this web one small component of a global commercial machine.
So we’re stuck at this point where a simplified diagram is almost unreadably busy, and that only comprises a infinitesimally tiny corner of the whole global commercial financial shebang. Why does any of this actually matter?
It matters because this is the part that actually passes through our homes. Flushing the toilet, running the tap, or rolling out the garbage cans are not infinitesimally small parts of our lives. This is the spot where we get to decide how much garbage we’re going to take.

Ray Dubicki is a stay-at-home dad and parent-on-call for taking care of general school and neighborhood tasks around Ballard. This lets him see how urbanism works (or doesn’t) during the hours most people are locked in their office. He is an attorney and urbanist by training, with soup-to-nuts planning experience from code enforcement to university development to writing zoning ordinances. He enjoys using PowerPoint, but only because it’s no longer a weekly obligation.