

(There’s a lot of data in the 2013 HUD report on homelessness. This is part 2 of The Urbanist’s series to better understand this data. You can see Part 1 here.)
Breaking The Data Into Comparable Pieces
One of the fundamental problems with understanding the numbers in the report is putting them in context. The report is largely broken down by geographic areas that are under Continuum of Care organizations (CoCs), as I discussed in the first post of this series. What this means is that the areas may not coincide perfectly with other commonly used geographic regions. This becomes problematic when trying to correlate this data with other data sets, like the census. It turns out, though, that many of the CoCs are defined by counties. A few are also defined by cities.
To narrow down my work, I focused on 54 CoCs with the largest homeless population in 2013. (The pictures below are actually from the 51 largest, because I wasn’t yet done with numbers for 3.) For these CoCs, I put together a table with the area’s total population and homeless population for 2012 and 2013. You can see those numbers here. With the population numbers, it becomes much easier to compare the relative scale of homelessness in different areas.
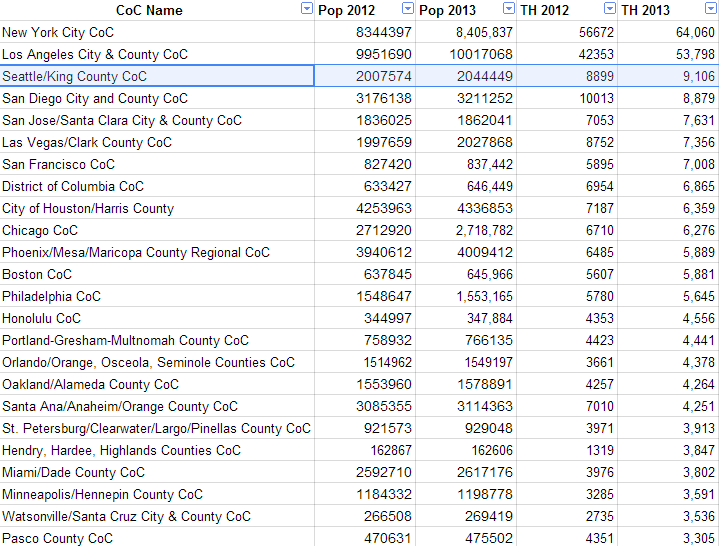
In a lot of ways, this data is pretty bad news for Seattle. First, the data shows that the Seattle/King County homeless population actually increased between 2012 and 2013. If you read Part 1, you’ll also note that Seattle’s homeless population grew between 2013 and 2014. The 2014 data for Seattle/King County isn’t in the HUD report, but given that the homeless population increased in Seattle, it’s likely that it also increased in the rest of the county.
As mentioned in Part 1, the Seattle/King County CoC had the 3rd highest number of homeless people in 2013. Previously, Seattle had the 4th largest homeless population. San Diego managed to decrease the number of people without housing by just over 1,000.
Additionally, this data shows that Seattle/King County has a larger number of homeless people than many other CoCs with higher populations. San Diego City and County, City of Houston/Harris County, Chicago, Phoenix/Mesa/Maricopa County and Santa Ana/Anaheim/Orange County all have a smaller population of homeless individuals than Seattle/King County but have larger numbers of residents. With that said, Seattle ranks 16th among 53 CoCs with the largest number of homeless people per capita:
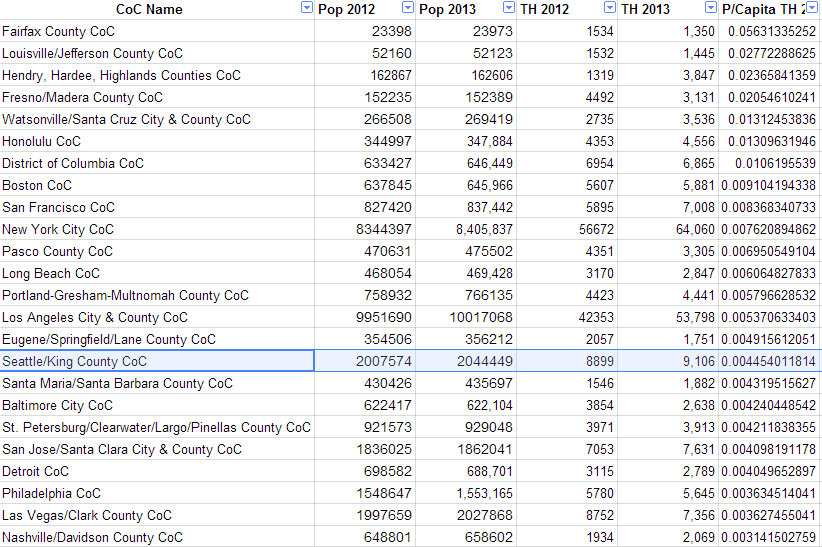
Surprisingly, the city of Fairfax, Virginia has the worst per capita homelessness rate. In 2012 Fairfax County had the third highest median income in the country.
The HUD report included statistics regarding the effectiveness of providing shelter. While providing housing is pretty expensive (although a lot of research indicates that providing housing is cheaper than not doing so, in the long run), shelter is an important stop-gap with much different political and logistical obstacles. Among the 53 cities, Seattle ranked 21st for providing shelter. Boston topped the list with an impressive with an impressive 96.7% of homeless people provided shelter.
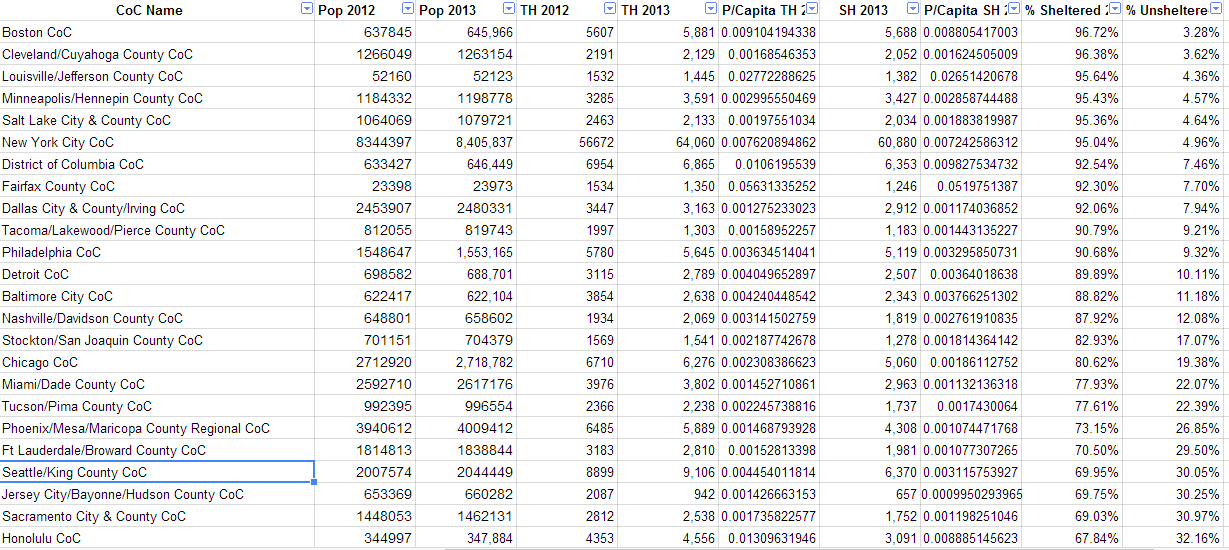
Among the 25 cities that were worst at providing shelter, Portland was the furthest north, followed by San Francisco. All the other cities were in pretty warm climates.
Take a look through the data to see if you can find anything interesting yourself.

Owen Pickford
Owen is a solutions engineer for a software company. He has an amateur interest in urban policy, focusing on housing. His primary mode is a bicycle but isn't ashamed of riding down the hill and taking the bus back up. Feel free to tweet at him: @pickovven.