Editor’s Note: This is Part 2 in a three-part series on measuring the success of Seattle’s urban village strategy. For background on the report, see our primer in Part 1, and then then take a look at some of the indicators in Part 3. In this article, Scott takes a look at 12 of 22 indicators from the report.

Resource Use and Conservation
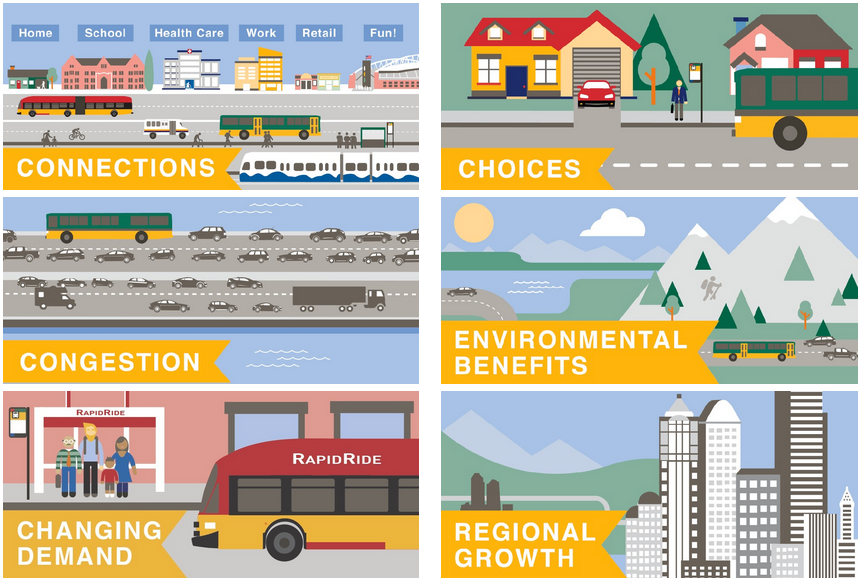
The six indicators in this category looked at how efficiently the city is using its resources, namely in the realms of traffic, utilities, and historic buildings. This is representative of environmental stewardship.
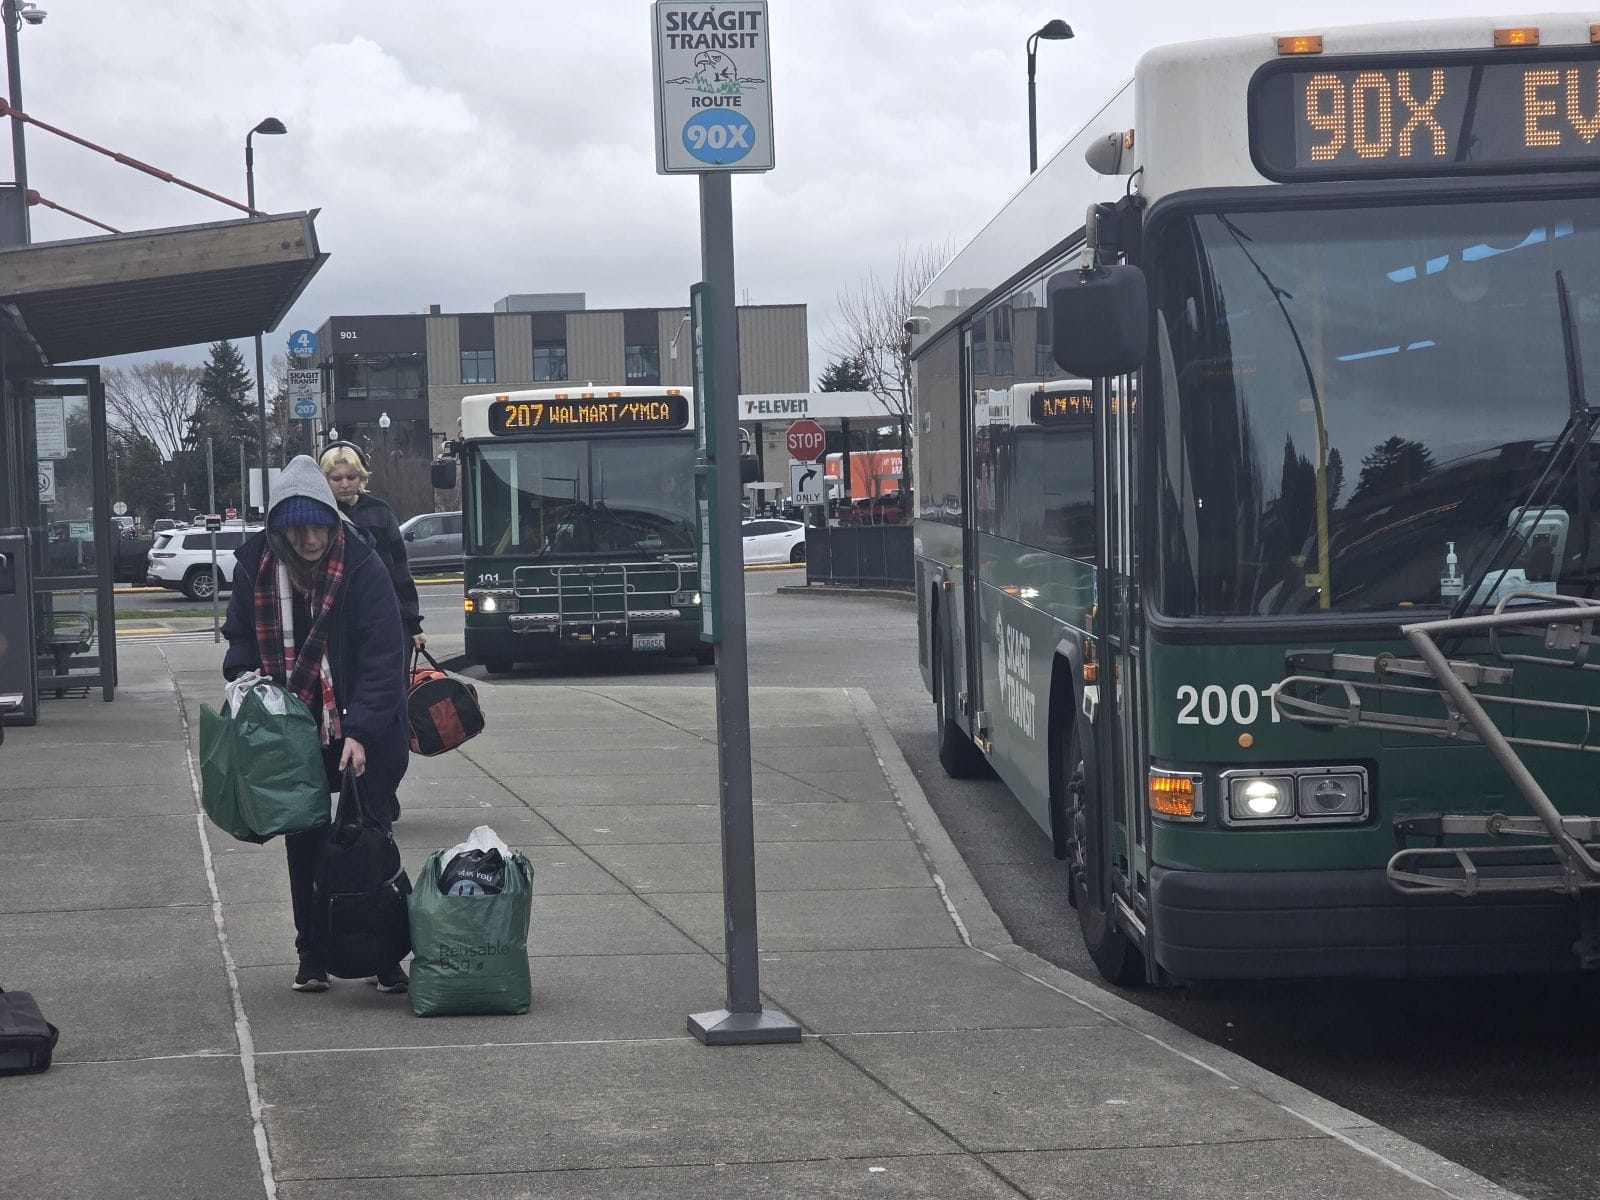
- Transit ridership: Seattle transit ridership continues to grow, with over 300,000 daily rides on the Metro bus system within city limits. From 2004 to 2014, ridership per person per acre increased in all of the study areas except Eastlake. This indicator does not include data from Sound Transit or other agencies.
- Traffic counts: Though traffic volumes have decreased over the past decade, of the ten study areas the U-District had the highest traffic volumes compared to its capacity. While the data didn’t include occupancy or vehicle types, an overall decrease in volumes suggest opportunities to reconfigure arterial streets with protected bike lanes and bus-only lanes.
- Residential energy use: Energy use per person has been steadily declining, dropping 17 percent from 4,777 kWh in 1994 to 3,948 kWh in 2010. While energy efficient appliances help, the project credits Seattle City Light’s conservation programs and environmentally minded residents. One-third of downtown’s commercial properties are LEED certified. Data was not available at the urban village level.
- Residential water use: Since 2004 water use per capital declined in all of the urban villages, except for a slight uptick in the U-District, which also has the lowest consumption on the order of 1,500 cubic feet per year. Not surprisingly, neighborhoods with lots of single family homes like West Seattle Junction have higher water use per capita, edging towards 3,000 cubic feet per year.
- Residential landfill waste: Also trending downward, this measure declined an impressive 30 percent from 1990 to 2010 to 0.19 tons (380 pounds) of solid waste per capita. While data is not available for urban villages specifically, the citywide recycling rate as of 2013 is 56.2 percent. The previous comprehensive plan set a goal for 69 percent by 2020, which will probably be met.
- Historic preservation: This simple measure only reported that the city has 346 official historic landmarks, with 180 of those added since 1994. While it is notable that downtown has the largest share, this indicator would be more useful if it provided any indication of the importance of historic landmarks or comparing preservation and demolition over time.
Healthy Communities
Indicators in this category reflect general well-being of neighborhoods, including safety and health.
- Crime related 911 calls: While not a perfect representation of actual crime statistics, this measure showed a decline in 911 calls to report violent, vice, and property crimes in all ten urban villages between 1998 and 2013. Downtown had the highest volumes in both years, and also the biggest drop. Emergency calls may be linked to residential stability and social cohesion in neighborhoods.
- Access to arts and culture: This measure counted theaters, galleries, arts offices, rehearsal rooms, libraries, music clubs, museums, and cinemas in each of the urban villages being studied, and expressed access to them as a ratio to the size of the village. Downtown scores best, with one cultural center for every five acres. The residential villages, such as Eastlake and Westwood, scored lowest. The authors acknowledge that while such amenities can enhance community spirit, they may also be indicative of gentrification and rising property values.
- Farmer’s markets: Of the ten villages studied, five have active farmer’s markets. Downtown alone has three, including two offshoots of Pike Place at City Hall and in Pioneer Square. Such markets provide access to local food and community cohesion. This measure is difficult to compare urban villages with, though there is a clear opportunity to expand the markets to neighborhoods without them.
- Community gardens: This indicator has more useful data for analysis, as the city’s Department of Neighborhoods runs a formal “p-patch” network of community gardens citywide. The program is so popular that the wait lists for plots average two years long. The authors indicate that an ideal ratio is one garden per 2,500 households. Three of the studied villages have no community gardens, while the U-District has the most at three. Megan Horst, a UW planning student, has done an inventory showing there are 45 unused city-owned parcels, 122 school properties, and 129 parks that are suitable for urban agriculture.
- Low birth weights: Defined as less than 5.5 pounds, the prevalence of low birth weights is a proxy for community health and nutrition. Downtown and Rainier Beach had the highest rates, over 8 percent during the 2000-2012 study period. But rates in the other eight villages varied widely. Efforts to address other public health problems, such as drug addiction or food deserts, could improve infant health.
- Life expectancy: From 2000 to 2010, average life expectancy at birth has been on an upward trend across the ten urban villages. But it also varies by quite a bit between them; children born in Lake City can expect to live to 80, while those born in Eastlake can expect to live to 85. Research has shown that availability of open space, exposure to pollution, crime, healthcare access, and a variety of other factors play into this indicator.
To learn more about the report, you can download it (PDF) from the Seattle 2035 website or view a summary presentation (PDF).
This article is a cross-post from The Northwest Urbanist, the personal blog of Scott Bonjukian. He is a graduate student at the University of Washington’s Department of Urban Design and Planning.