Housing and transportation costs are closely intertwined.
Getting the true cost of housing requires calculations beyond the costs paid for rent or mortgage.
The federal livability index takes into account not only the cost of providing a roof over your head, but also transportation cost.
Homes that are further from the city center often cost less to rent or purchase, but the cost of commuting from those places is greater. This inverse relationship between housing and transportation costs creates a conundrum for individuals who are shopping for a place to live.
To help people understand the true cost of housing, the Department of Housing and Urban Development teamed up with the US Department of Transportation to create the livability index. Here’s what Seattle’s livability looks like:
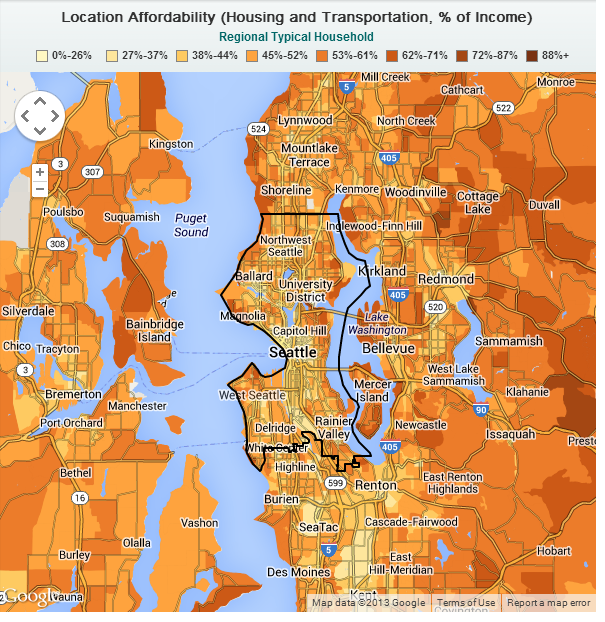
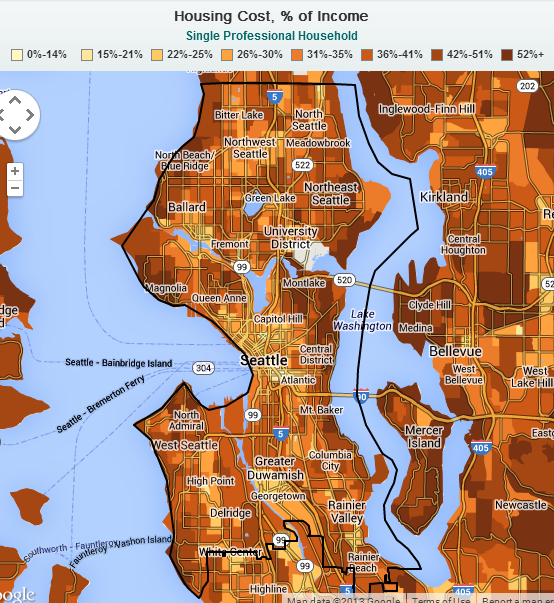
The darker areas have higher housing and transportation costs, while the lighter areas have lower combined costs. The map also makes it very easy to see the impact of transportation costs on overall livability by allowing you to isolate different costs, showing only that of transportation or that of housing. Here I’ve isolated housing costs for a single professional (median income of $54,000):
You can go through some iterations yourself by visiting the website.
The tool also includes some interesting statistics. The average single, professional household in Seattle has one car, drives 9,480 miles per year and takes 137 transit trips. Additionally, the average single professional spends 33% of their income on housing and transportation.

Owen Pickford
Owen is a solutions engineer for a software company. He has an amateur interest in urban policy, focusing on housing. His primary mode is a bicycle but isn't ashamed of riding down the hill and taking the bus back up. Feel free to tweet at him: @pickovven.