Last week on Twitter, I provocatively asked, “Was the Rainier Ave road diet pilot a failure?“ While any roadway improvements that convert four lanes to three is undoubtedly an improvement, the Rainier Ave safety pilot project has some questionable design choices. In addition, the metrics and data that Seattle has used to measure success are invalid. Collisions have not been reduced, speeds have not dropped as much as reported, and the increase in traffic on Martin Luther King Jr. Way could also be resulting in additional crashes (as reported by the South Seattle Emerald).
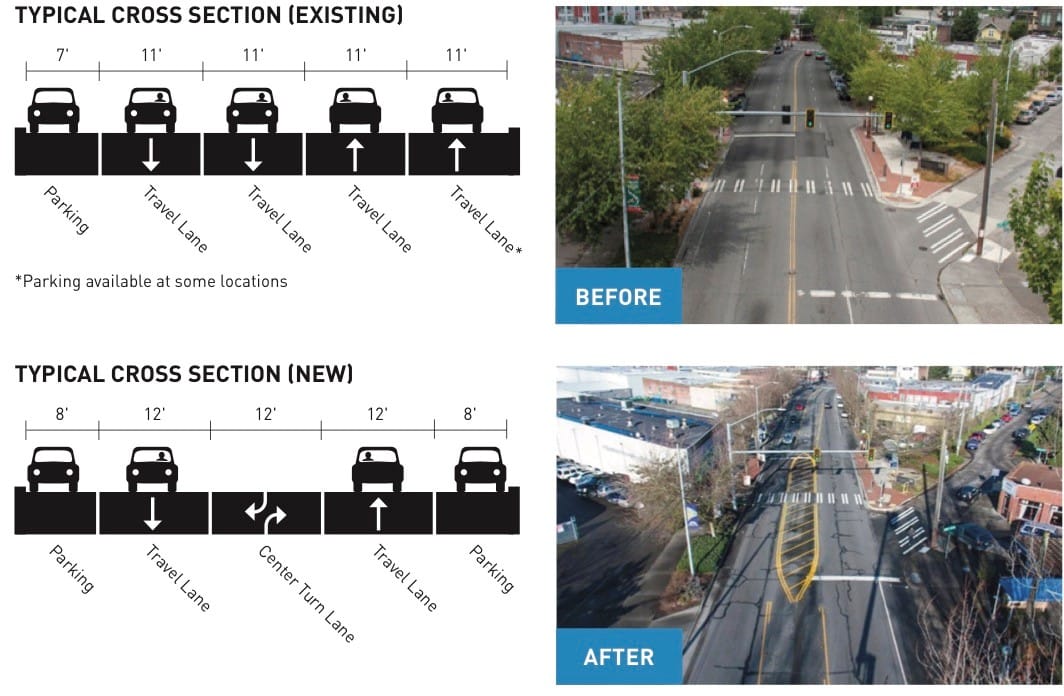
Rainier Ave S was converted from four lanes to three between S Alaska St and S Kenny St. Seattle has pioneered this type of four-to-three road diet over the past 30 years. We’ve seen some incredibly successful road diets, such as what was done in 2013 to NE 75th St–that road diet actually managed to vastly decrease speeds while also decreasing overall travel time and collisions. It’s also important to note that just as many drivers used it after the road diet (there was actually an increase in number of daily average vehicles). This is a key point that street safety advocates use when attempting to convince neighbors to support a road diet; just as many people will still be able to drive on the street, it will simply be calmer and safer. But the Rainier Ave project saw a decrease in daily average vehicle volumes by more than 27%, a huge decrease.
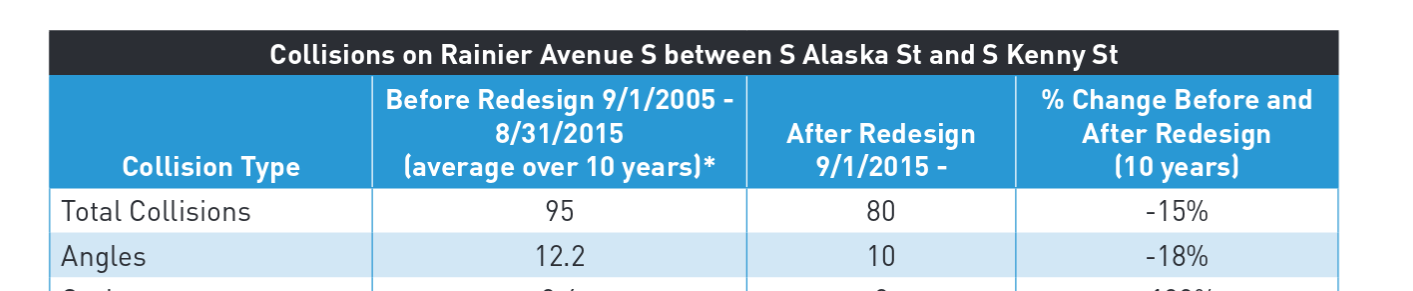
We would expect that as traffic volumes went down, collisions would also go down. The Seattle Department of Transportation’s (SDOT) before-and-after evaluation of the corridor reported a 15% drop in collisions. However, according to Seattle’s collision data, there were 94 collisions on the corridor between September 1, 2015 and September 1, 2016 (data). Since it’s also problematic to use numbers immediately after a roadway change (when drivers are still getting used to things), I instead examined collisions along the corridor for the full years of 2014 and 2016. In 2014, there were 99 collisions and 45 injuries (data). In 2016, there were 97 collisions and 54 injuries (data). This raises a number of serious concerns.
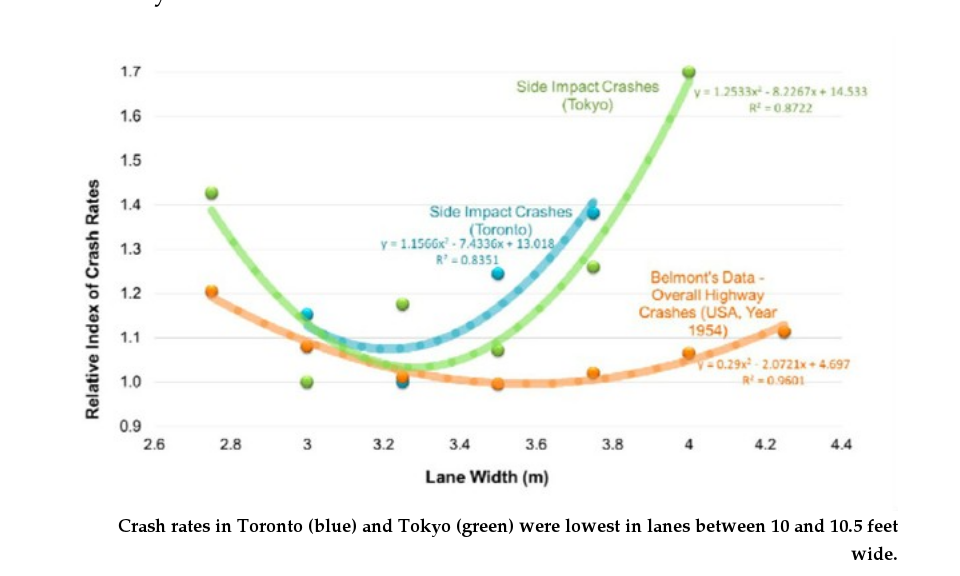
There have been numerous studies showing that wider lanes result in faster vehicle speeds. One of the concerns I had about this road diet was the widening of travel lanes from 11 feet to 12 feet. The graph above is from a study that shows crashes are minimized when lanes are around 10 to 10.5 feet wide, which is why safety experts advocate for 10-foot lane widths on arterials. A 12-foot-wide travel lane will encourage speeding, so it’s worth digging into the speed data to see what’s going on.
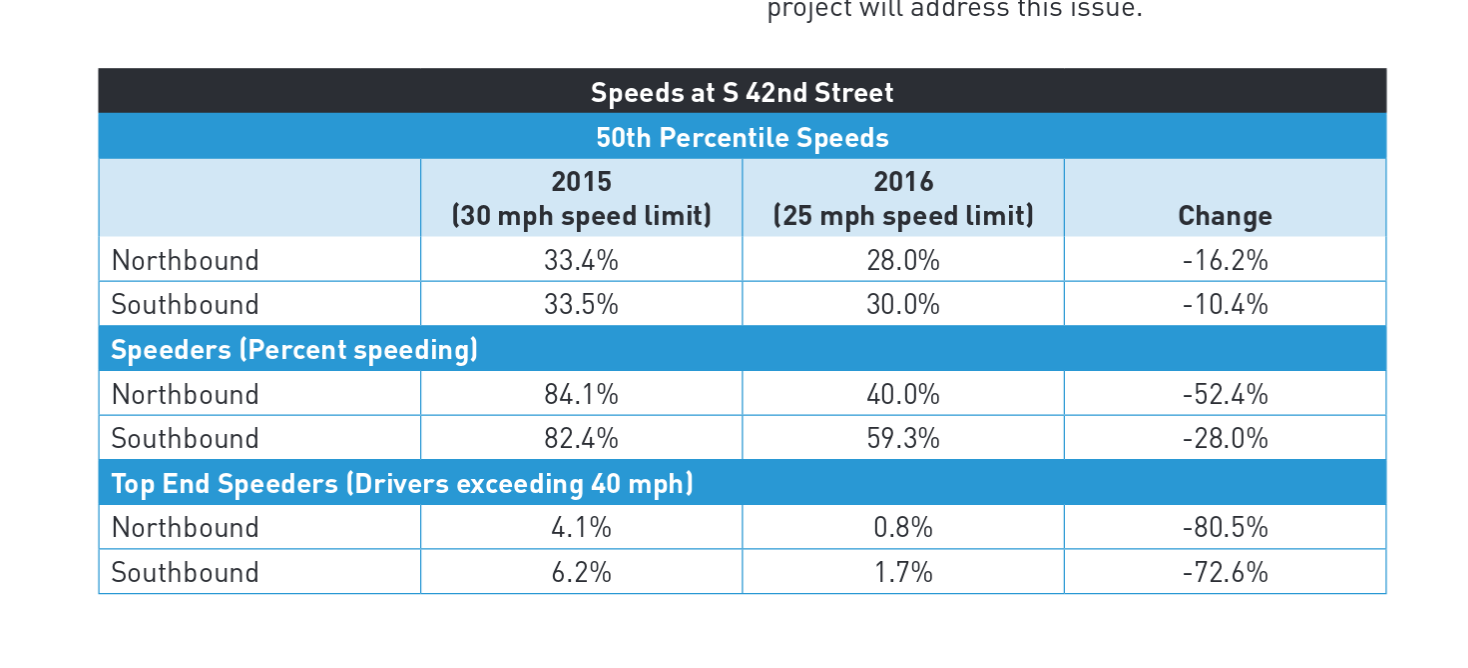
The posted speed limit on this portion of Rainier was changed from 30 mph to 25 mph. SDOT’s evaluation said overall speeds were reduced by 16% and 10%. However, there’s a big red flag there–SDOT measured the speeds using 50th percentile. That’s a measurement of the median speed of drivers. Every single past safety project done by SDOT has instead looked at 85th percentile speeds. The 85th percentile speed is the speed at which 85% of drivers are traveling at or below. By definition, 50th
percentile speeds will be lower than 85th
percentile speeds (unless drivers are all driving the same speed).
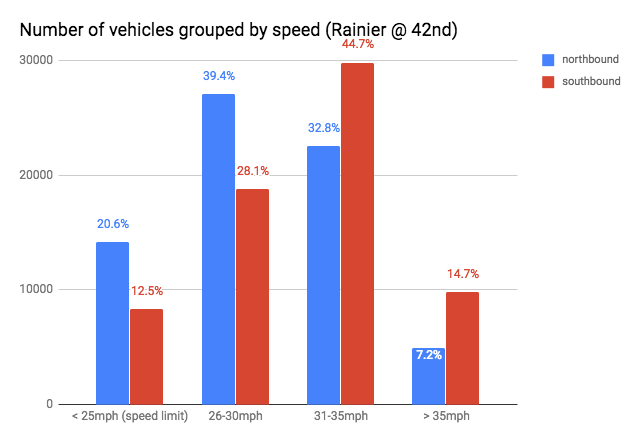
In theory, this sounds great–with a 25 mph speed limit, the median speed was 28-30 mph. However, this means that half of recorded vehicles were traveling at more than 5 mph over the speed limit. The 85th
percentile speed data, which was calculated at 33-35 mph (2016 data), gives us a more accurate representation of the fact most drivers were going significantly faster than the speed limit. The above graph attempts to show why it’s important to use 85th percentile speeds for studying safety. You can clearly see that there are too many vehicles traveling between 31-35 mph, well above the median speed. More than one out of every ten drivers were going more than 10 mph over the speed limit. The raw data shows that over the course of a week, 73 drivers were exceeding 50 mph! According to the data I received from SDOT, 85th percentile speeds declined 10% northbound (37 mph to 33 mph; 2014 nb data), and only 7% southbound (37.7 mph to 35 mph; 2014 sb data).
We should applaud the City for, as SDOT’s Jim Curtin explains, “setting speed limits [on Rainier] using the 50th percentile. The Feds (Federal Highway Administration) do provide guidance for using 50th percentile speeds in ‘developed areas’.” However, he also explains that, “[SDOT] will only use the 50th percentile to evaluate projects if the 50th percentile is used to set the posted speed limit. To date, we’ve used this method only on Rainier.” It’s not clear that 50th percentile should ever be used in traffic studies when determining if additional safety improvements are needed.
There are a lot of unanswered questions. It’s difficult to draw conclusions from only a single year’s worth of data, but it’s clear to me that the Rainier Ave safety project should be much more aggressive. We’ve had a number of past attempts at safety improvements along the corridor, and we owe it to the families and neighbors who live, work, play, and travel along Rainier Ave S to finally make this street safe.
SDOT has an online open house for Phase 2 of the Rainier Ave S Corridor Project. The deadline to comment is today (Thursday, August 31
,2017). Be sure to fill out the survey here: https://rainieraves.participate.online/. Another great opportunity is The Urbanist’s tour of Rainier Avenue at 10am Saturday September 9. SDOT staff will be there to answer your questions and listen to your input.
Correction: This article has been updated since publication, with a correction made to the chart showing distribution of driver speeds along Rainier Ave after the road diet and accompanying text clarifying the language around the error in the chart. We had said “almost a quarter of southbound drivers were traveling more than 10 mph over the speed limit.” It now reads, “More than one out of every ten drivers were going more than 10 mph over the speed limit.