When it comes to adding seats in the state legislature, the 2020 election was a wash for Washington Democrats. State Senator T’wina Nobles (D-Fircrest) is an exciting addition, but State Senator Dean Takko (D-Longview) lost his seat, meaning the senate is still 28-21. Democrats can lose three caucus votes and still pass bills (without Republican votes), but not more–doesn’t leave a lot of wiggle room.
One of those frequent defectors is State Senator Mark Mullet, a center-right Democrat from Issaquah who won re-election by the narrowest of margins–58 votes–over nurse Ingrid Anderson, who was backed by labor and progressive groups. Governor Jay Inslee endorsed Anderson in hopes of bolstering his climate agenda, which Mullet has largely opposed. Inslee also threw his weight behind Nobles, Daniel Smith in the 17th, and Helen Price Johnson in the 10th, who all faced Republican incumbents. Price Johnson led on election night, but late results swung the election to incumbent Ron Muzzall (R-Oak Harbor). Daniel Smith lost by nine points.
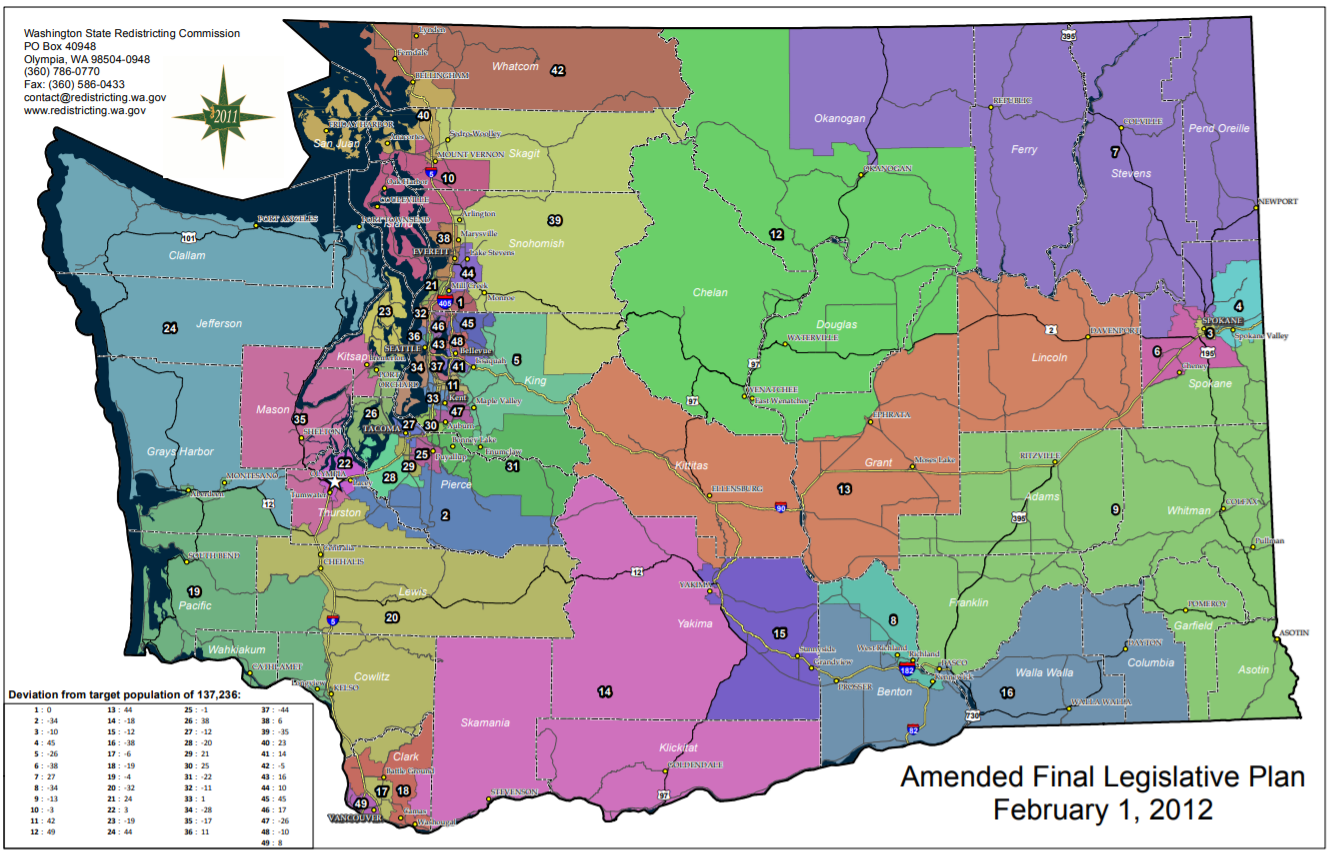
While those losses were tough, redistricting could end up swinging these district in Democrats’ favor. The results of the 2020 Census will guide redistricting decisions since every district must be reset to have a nearly identical population once more, as was true in 2011 (using 2010 Census figures). Slow-growing districts will need to expand to capture enough population, and fast-growing districts will shrink in geographic size. In redistricting speak, the slow-growers are “underpopulated,” and the fast-growers “overpopulated.” Since it grew the most by far, Seattle will add representation most of all, carving out nearly half a district from its neighbors with a domino effect that may ripple far into the suburbs.
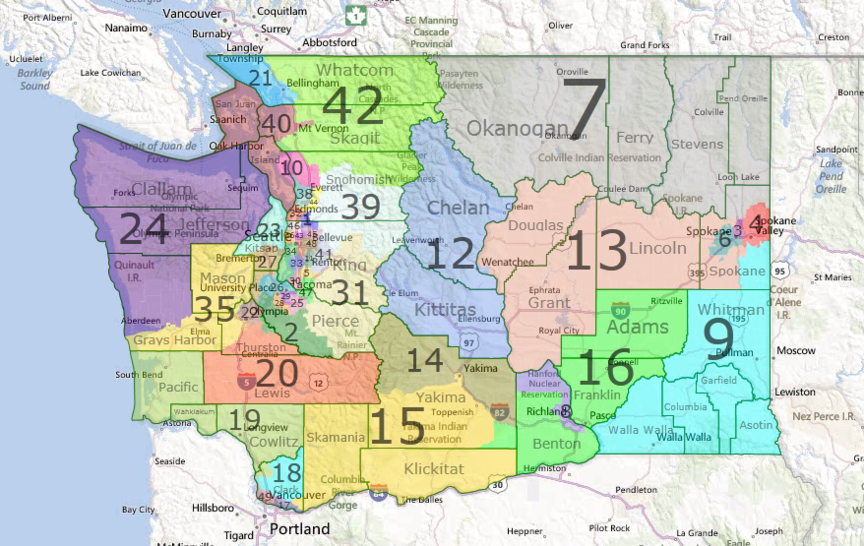
As a baseline, Washington state has grown nearly 14% in the past decade based on preliminary figures. That means a district that has grown 14% is treading water. Beat 14% growth and a district will shrink in geographic size, while falling short of 14% points toward expanding boundaries to take in more population. Seattle grew 25% in the past decade, adding about 152,000 residents–nearly half of King County’s expected gain of about 330,000 and 16% of the state’s total population growth of 931,660, as of April figures from the state Office of Financial Management. The state’s fastest growing district is the 43rd, with the 36th, 37th, 48th, and 1st also near the top, according to a Seattle Times analysis.
Other fast-growing regions beyond the Seattle metropolitan area include the Tri-Cities, Thurston County, and Clark County. Nearly everywhere else grew below the state average. Already the least populated county, Garfield appears set to grow smaller still, losing 41 people. Whatcom County grew right near the state average, meaning those boundaries should largely be the same for a big showdown for the state senate seat held by Doug Ericksen (R-Ferndale) who is a Trump ally and worked on his EPA transition team.
Composed of booming Portland suburbs and exurbs, the 17th District is likely overpopulated, too. Clark County has grown by more than 17% since 2010. The 17th’s boundaries appear likely to contact and jettison the more conservative northern fringes of Clark County. That may be enough to erase the nine-point advantage Republican Lynda Wilson enjoyed in 2020–particularly when paired with a more dynamic candidate running a more exciting campaign. For example, Tanisha Harris’ house race in the 17th was six points closer than Smith’s race.
The 10th District spans three counties: Island, Skagit, and Snohomish. Since Island County is slow-growing (9%), the boundaries will likely expand into fast-growing Snohomish County, with 38th District offering some of its territory. Snohomish County has increasingly been fertile ground for Democrats.

If those assumptions are correct, Democrats could finally flip the 10th and 17th.
Another interesting case is the 26th District, where Senator Emily Randall proved a Democrat could win in 2018, but Democrats were unable to follow up that victory by winning the two house seats in 2020. Carrie Hesch came up about 5,000 votes short in unseating Representative Jesse Young (R-Gig Harbor). As a comparatively slow-growing district, it’s likely to expand and most of the surrounding districts lean Democratic, save for the 35th District, which is even slower growing. A redistricted 26th may cement Randall’s reelection and be a helpful nudge for Hesch in a rematch.
While the conservative pundits may not think it possible, the 43rd could become more progressive if its consolidated around Capitol Hill and the U District, dropping single-family-home heavy northern precincts. That could aid a progressive challenge to Senator Jamie Pedersen, who is up for reelection in 2022. Likewise the overpopulated 36th District is likely to lose some northern precincts, potentially aiding a progressive challenge to Senator Reuven Carlyle. Consequently, the boundaries of the 32nd and 46th are likely to shift to the south, catching more of Seattle.
On the flip side is the 19th–the only district where Democrats have ceded ground in the last election with Brian Blake also losing his House seat and canceling out the gain in the 42nd with Alicia Rule’s victory. The underpopulated district has drifting to the Right and isn’t likely to be interrupted even though its borders will need to expand. The neighboring 35th, 20th, and 18th districts are all Republican-held.
State law puts redistricting decisions in the hands of a four-member bipartisan commission with two Democrats and two Republicans selected by leaders of the respective caucuses in the state legislature. The redistricting commission’s decisions could be rushed or pushed back since the United States Census Bureau has struggled to finalize its results due to disruptions from Covid and Trump administration shenanigans.
“The Census Bureau missed its Dec. 31 deadline for delivering state population estimates, citing potential problems with COVID-19 restrictions and with the accuracy of its data,” Jim Brunner wrote in The Seattle Times. “The bureau issued a statement last week saying it hoped to complete its count ‘as close to the statutory deadline as possible,’ probably in early 2021.”
The way Washington does redistricting has drawn criticism, including from the Washington Census Alliance, a coalition of 92 groups pushing for greater representation for marginalized communities, Brunner reported. Washington Census Alliance director Kamau Chege said the focus on partisan interests is leaving communities of color behind. His organization’s goal for this redistricting include consolidating Latino voting power in a legislative district more centered in Yakima, where Latinos are about half the population.
“Chege said the group’s 2021 goals include redrawing Central and Eastern Washington legislative districts that split the lands of the Colville and Yakama Indian tribes. In addition, he pointed to districts in the Yakima area that divide Latino vote strength,” Brunner wrote. “That doesn’t seem to be something we can tolerate moving forward,” said Chege, calling the current maps “a real failure of having an all-white redistricting commission [in 2011].”
The Democrats’ picks for the commission did reflect a desire for more diverse representation. Senate leaders selected former state representative Brady Piñero Walkinshaw–first Latino redistricting commissioner in state history–and House leaders selected Washington State Labor Council Secretary Treasurer April Sims.
“I am honored to be the first woman of color and Black person appointed to serve on Washington’s Redistricting Commission,” Sims said in a statement. “I look forward to working with my fellow Commissioners to develop a process that is fair, transparent, inclusive, and in line with the values of our state.”
The commission’s map is due November 15th, with the redrawn map set to go into effect in the 2022 midterm election. The state legislature has until the 30th day of the 2022 session to amend the map by a two-thirds vote. The changes can’t be large; the alterations cannot effect more than 2% of the district’s population.
Correction: This article has been updated to include Washington’s 2012 state legislative district map. The previous map drawn in 2002 was the only map included previously.
Population growth by county:
| County | 2010 Population | 2020 Population | Pop. Change | Growth rate |
|---|---|---|---|---|
| Adams | 18728 | 20450 | 1722 | 0.0919 |
| Asotin | 21623 | 22640 | 1017 | 0.0470 |
| Benton | 175177 | 205700 | 30523 | 0.1742 |
| Chelan | 72453 | 79660 | 7207 | 0.0995 |
| Clallam | 71404 | 76770 | 5366 | 0.0751 |
| Clark | 425363 | 499200 | 73837 | 0.1736 |
| Columbia | 4078 | 4185 | 107 | 0.0262 |
| Cowlitz | 102410 | 110500 | 8090 | 0.0790 |
| Douglas | 38431 | 43750 | 5319 | 0.1384 |
| Ferry | 7551 | 7910 | 359 | 0.0475 |
| Franklin | 78163 | 96760 | 18597 | 0.2379 |
| Garfield | 2266 | 2225 | -41 | -0.0181 |
| Grant | 89120 | 100130 | 11010 | 0.1235 |
| Grays Harbor | 72797 | 74720 | 1923 | 0.0264 |
| Island | 78506 | 85530 | 7024 | 0.0895 |
| Jefferson | 29872 | 32190 | 2318 | 0.0776 |
| King | 1931249 | 2260800 | 329551 | 0.1706 |
| Kitsap | 251133 | 272200 | 21067 | 0.0839 |
| Kittitas | 40915 | 48140 | 7225 | 0.1766 |
| Klickitat | 20318 | 22770 | 2452 | 0.1207 |
| Lewis | 75455 | 80250 | 4795 | 0.0635 |
| Lincoln | 10570 | 11050 | 480 | 0.0454 |
| Mason | 60699 | 65650 | 4951 | 0.0816 |
| Okanogan | 41120 | 43130 | 2010 | 0.0489 |
| Pacific | 20920 | 21840 | 920 | 0.0440 |
| Pend Oreille | 13001 | 13850 | 849 | 0.0653 |
| Pierce | 795225 | 900700 | 105475 | 0.1326 |
| San Juan | 15769 | 17340 | 1571 | 0.0996 |
| Skagit | 116901 | 130450 | 13549 | 0.1159 |
| Skamania | 11066 | 12220 | 1154 | 0.1043 |
| Snohomish | 713335 | 830500 | 117165 | 0.1642 |
| Spokane | 471221 | 522600 | 51379 | 0.1090 |
| Stevens | 43531 | 45920 | 2389 | 0.0549 |
| Thurston | 252264 | 291000 | 38736 | 0.1536 |
| Wahkiakum | 3978 | 4210 | 232 | 0.0583 |
| Walla Walla | 58781 | 62580 | 3799 | 0.0646 |
| Whatcom | 201140 | 228000 | 26860 | 0.1335 |
| Whitman | 44776 | 50480 | 5704 | 0.1274 |
| Yakima | 243231 | 258200 | 14969 | 0.0615 |
| LD Average | 137236 | 156249 | 19013 | 0.1385 |
| Washington state | 6724540 | 7656200 | 931660 | 0.1385 |
Washington State Legislature Swings to the Left, Setting the Stage for Progressive Reforms