Vision Zero was formally launched in 2015 and set the goal of zero traffic deaths and serious injuries in Seattle by 2030. Eight years in, the traffic fatalities — especially for pedestrians, cyclists, and scooterists — have not slowed. Furthermore, hot spots for pedestrian fatalities continue to remain consistent. My analysis found 54 pedestrian deaths and seven cyclist deaths have occurred in Seattle since 2020.
An interactive map of traffic fatalities, 2020 onward
I created an interactive map of every pedestrian and cyclist death caused by motorists recorded since 2020. Hovering over each point gives a victim name, date, and location.
To find the data for this map I consulted the the February top-to-bottom Vision Zero review, which provides a map of fatalities from 2015 to 2021, and the Seattle Police Department (SPD) blotter. Cross-referencing with the SPD blotter was important because the Vision Zero review map does not give any specific information about the corresponding incidents and more updated traffic fatalities are not included in the map.
Police blotters, on the other hand, give “preliminary write-ups on significant incidents,” including significant traffic and collisions. While the blotter is not fully comprehensive — it identifies just eight of the 16 pedestrian fatalities in 2022, for instance — it is the most readily available source of public information on recent traffic fatalities. The Seattle Department of Transportation (SDOT) maintains a more extensive collision database, but it’s pretty intimidating to wade into and takes some fiddling with filters to narrow down the sea of data into preferred parameters — in our case deadly collisions since 2020.
Below is a map illustrating the most up-to-date and comprehensive view of recent traffic deaths.
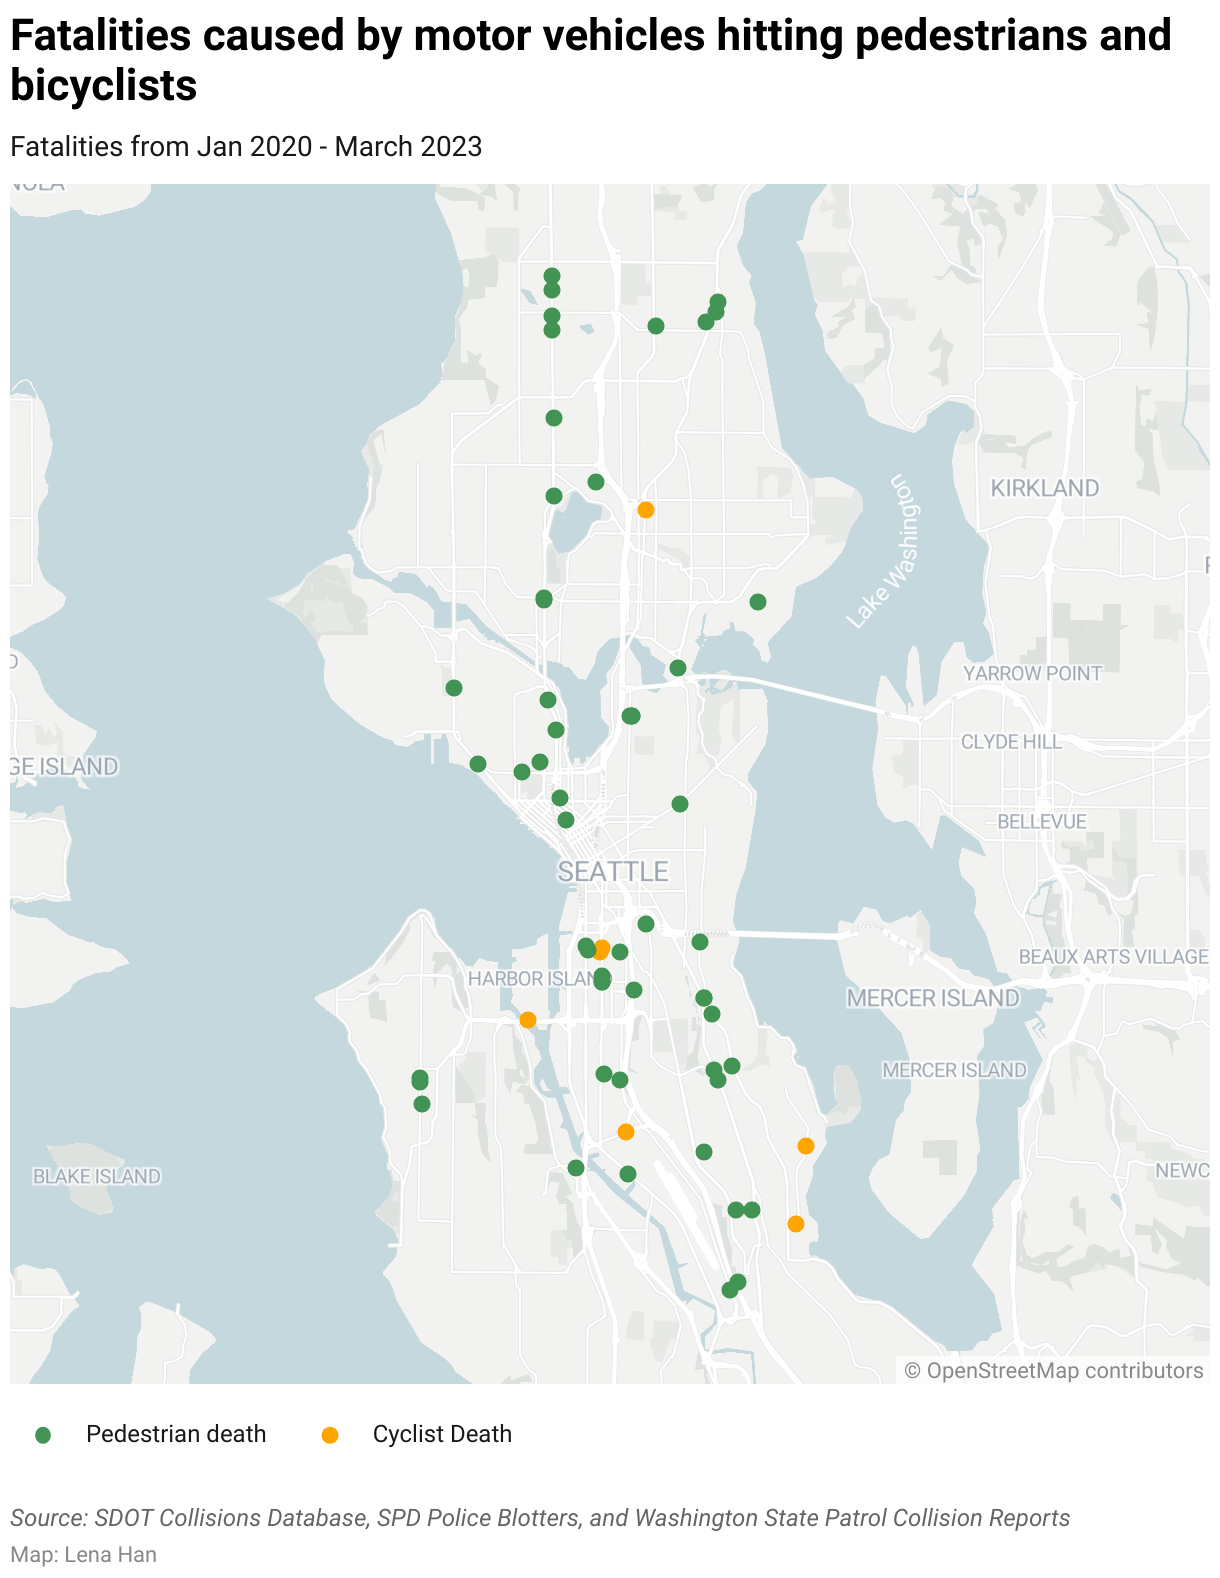
My map shows that recent fatalities have spread across all districts in Seattle. Three pedestrian deaths have already occurred in 2023, in SoDo, Miller Park, and South Lake Union.
Fatalities have concentrated near freeways and major roads. In Bitter Lake, between 125th and 141st street on Aurora Avenue, four fatalities have happened in the past three years. In Lake City, three fatalities have occurred by Lake City Way NE. On South Holgate Street in SODO, two cyclist fatalities occurred in nearly the same spot four months apart.
In line with older data from SDOT, District 2, the southeastern district of Seattle, has had the most fatalities in the past three years.
Streets with poor infrastructure near high-speed freeways are ripe for crashes. While SDOT has identified these issues — noting that most pedestrian deaths happen on arterials, and implementing potential solutions such as reconfiguring lanes, “no turn on red” signals, and enhanced pedestrian lanes — they have yet to reduce the number of fatalities on Seattle streets. And in the past three years, dozens of pedestrians and cyclists have paid the price.
What the most recent Vision Zero review tells us is that traffic fatalities are still increasing. Clearer data on where these fatalities occur would bring more accountability to the process. Ultimately, the Seattle city government has a responsibility to improve its publicly available data on the road to eliminating traffic fatalities.
SDOT’s Top to Bottom Review of Vision Zero Barely Skims the Surface
Seattle Greenways Offers Their Own 90-Day Review of SDOT’s Vision Zero Safe Streets Campaign