
Why do Seattle rents continue to rise to higher and higher levels of unaffordability?
A new narrative has taken hold to explain this: the housing shortage.
The housing shortage narrative has largely replaced the language of supply-and-demand, which has recently been criticized for being too reminiscent of trickle-down economics or too simplistic (although some still favor it).
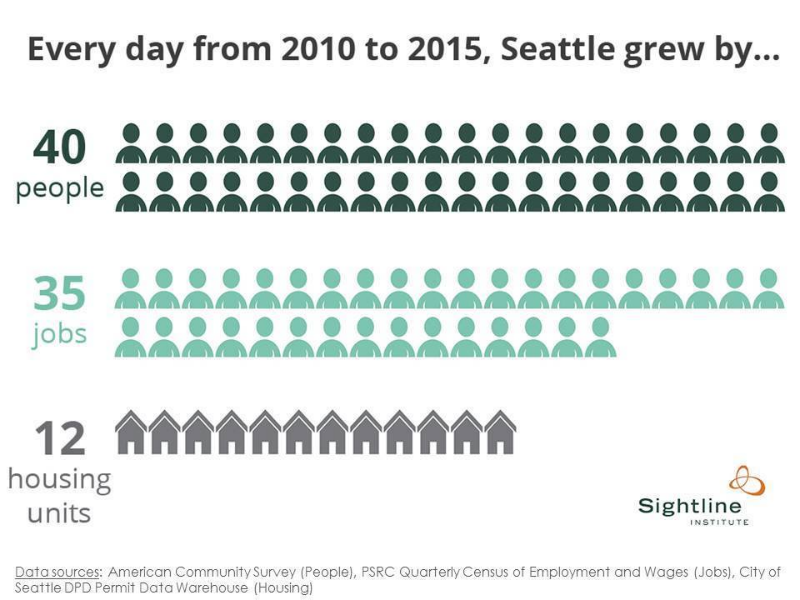
The essence of the shortage argument is the same as the supply-and-demand argument, though. Simply, when the production of housing outpaces the demand for housing we have a housing surplus. When housing production falls behind demand we have a housing shortage. But pictures speak louder than words (or supply curves) so local think tank Sightline provides an infographic to demonstrate the housing shortage in Seattle. It’s just one example of the shortage argument but it’s a popular one and provides actual figures. It was employed recently during a presentation at the Capitol Hill Renters’ Summit (with heavies like Mayor Murray, Councilmember Sawant, and House Speaker Chopp speaking) to drive home the point that we aren’t building enough housing units to keep up with demand.
And the reason we’re not building enough, the argument goes, is “restrictive land use regulations.” How can we possibly solve the affordable housing crisis when government is getting in the way of building new housing? This reinforces the common refrain that regulations are the primary cause of the housing crisis.
In this piece I will argue that there is no general housing shortage, that the catastrophic figures above are a product of the Great Recession and the normal lag in construction. Because the market appears to be duly responding to demand, efforts to “free” the housing market are not as effective as efforts to shape the market toward more just ends.
Returning to the evidence for the shortage argument, the numbers in the infographic, upon closer examination, are a little suspicious. To begin, the graphic uses “people” instead of “households” which has caused some confusion. Each housing unit shelters about two people in Seattle so we can conveniently convert “people” into “households” to be more readily compared to housing units. Taking this into account, the graphic actually shows a deficit of about eight housing units (40 people means 20 households minus 12 housing units produced) per day from 2010 to 2015. An eight unit daily deficit from 2010 to 2015 adds up. In fact, it wipes out nearly all vacant housing in Seattle. If these numbers are right the vacancy rate would have fallen to almost 0% by the end of 2015. It didn’t. Vacancy rates did drop but much less than the graphic implies: about 6% to 4% (give or take a half a percent depending on the survey).[1] There are, however, two other explanations for the dramatic deficit:
- The number of people per housing unit increased, putting more people in each housing unit.
(The opposite happened: the trend of smaller households continued, going from 2.06 people per household in 2010 to 2.02 people per household in 2015),
or
- The number of homeless people–living without housing units–increased.
(This did happen: Seattle’s homeless population went from about 2,000 to 2,800, an alarming increase but nothing near the scale needed to explain the deficit.)
This is the first indication that something is wrong. The figures don’t make sense. You can verify the figures for yourself, including population, jobs, and housing units going as far back as 2005 (the earliest year the city breaks out new housing units and demolitions) in the attached spreadsheet.
Below, the Sightline infographic is reproduced based on the same sources but going back to 2005 and, because population is not directly comparable to housing units and the confusion that has caused, household growth is used instead of population growth.
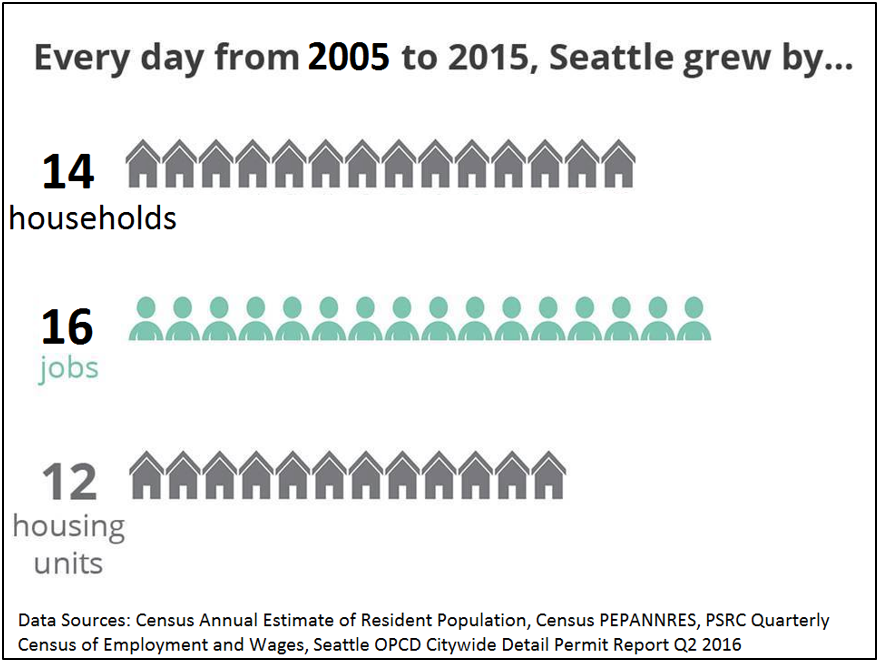
That’s not the catastrophe the Sightline infographic depicts but still not quite enough housing units to meet the new demand. Going back to the vacancy rate sniff test, we find that the 2005 to 2015 data does make sense with the vacancy rate change over the same period–6% to 4%–or, a roughly 6,000 unit deficit.[2]
So, is the private market working by responding to new demand? Housing development takes time–6 to 12 months for residential projects and longer for larger commercial projects. It can be a year or more before a hiring boom is spotted until units go up and even longer if other frictions like tight credit or limited labor supply slow projects. When you compare population growth to housing growth over a period that begins in the very dumps of the Great Recession with a lingering credit crunch to boot, is it any wonder that it looks like a near-impossible housing shortage? When you go back to 2005 (the earliest available year for annual housing units) the shortage all but disappears.

What becomes clear in the longer timeframe is a lag between demand (households and jobs) and supply (housing units). As jobs dramatically fell from 2008 to 2009, housing units actually increased as projects that had already been started before the downturn were completed. Then beginning in 2010 and going through 2012, unit production falls to relatively low levels. Meanwhile, job and population growth rebounded quickly starting in 2011, led by the unexpected hiring boom at Amazon. But it wasn’t until 2013 that housing production responded in kind. Since then, growth in new housing units have matched growth in new households.
“Restrictive land use regulations” are not to blame for the drop in housing production from 2010 through 2013. The rich irony of the Sightline infographic and the housing shortage narrative that accompanies it is that, upon closer examination, the housing shortage between 2010 to 2015 was not the result of restrictive local regulations but restrictive global capital.
Based on the expanded survey of supply and demand in Seattle, there is virtually no general shortage of housing. The data show supply responds to demand, just not immediately. The delay is likely due to the natural lag in construction and, beginning in 2010 the effects of a global financial crisis. Not only are Seattle builders now matching new population growth with new housing units, they are building at or near the construction industry’s capacity. Skilled construction workers are hard to come by. Seattle has more cranes than any American city yet they are still in short supply.
But haven’t restrictive land use regulations made it harder to build new units? Anecdotes abound but you wouldn’t know it from looking at the data. In fact, permitting turnaround time for medium and complex projects (the kind of projects that produce new housing units) in Seattle appear to have no relationship with the number of units that get built. Permitting times were typically shortest in the recession years following 2008 when, not coincidentally, there were fewer applications. Which isn’t to say that bad land use regulations don’t have bad social consequences, just that the regulations we have aren’t preventing the market from responding to new people with new housing. So, in this sense, the “just build” crowd have gotten what they want: no regulatory yokes on the market bull. And, yet, here we still are.
The housing shortage narrative obscures the real problem: out of control rents. There is, however, a specific housing shortage for those without the means to afford all this plentiful new housing. And it’s because of this specific shortage that simply building more housing doesn’t address the fundamental problem. To address the specific shortage, it’s time we started looking at specific solutions including a progressive income tax, rent stabilization, and aggressively capturing the value concentrating in urban land so it can be funneled into affordable housing. In a future article, I will lay out a housing affordability program that blueprints specific solutions, particularly a politically and economically feasible concentrate-and-capture land value scheme. In the meantime, a housing affordability program that says “just build” and nothing more is pouring water into a glass that’s already full.
[1] 2008-2011 was a period of unusually rapid change in the housing market. Not only did vacancy rates swing wildly but, according to the Dupre+Scott Seattle rental vacancy survey, the spread between gross vacancy and market vacancy (which excludes vacant units during lease-up) quickly expanded to historic levels before contracting during a 24 month period that includes 2010, a possible explanation for the discrepancy in the Sightline infographic – albeit one that I could not corroborate with other vacancy surveys that provide less fine detail.
[2] If you do the math from the expanded survey infographic, you get 2 unit daily deficit * 365 days in a year * 11 years = 8,030 units. The discrepancy between 6,000 units and 8,030 units is a rounding error. Net population change over that 11 year period is 113,490. Net housing unit change over that 11 year period is 49,486. 1134,490 people / 2.06 people per unit – 49,486 units = 5,606 unit deficit. See the linked spreadsheet for more information.
Top image: What Housing Deficit by Christine Hou