The Seattle Parks and Recreation (SPR) is in the process of forming their 2017 Parks Development Plan. One of the key aspects of the plan is to determine what types of improvements and new facilities SPR should construct over the next six years. To inform that process, SPR is conducting a comprehensive open space gap analysis. The gap analysis weights a variety of measures that dissect differing social, spatial, and qualitative elements. The resulting gap analysis map is multi-layered with seven primary interactive map themes: park space, access, walkability, gaps in walkability opportunity, equity, and population density.
Park Spaces
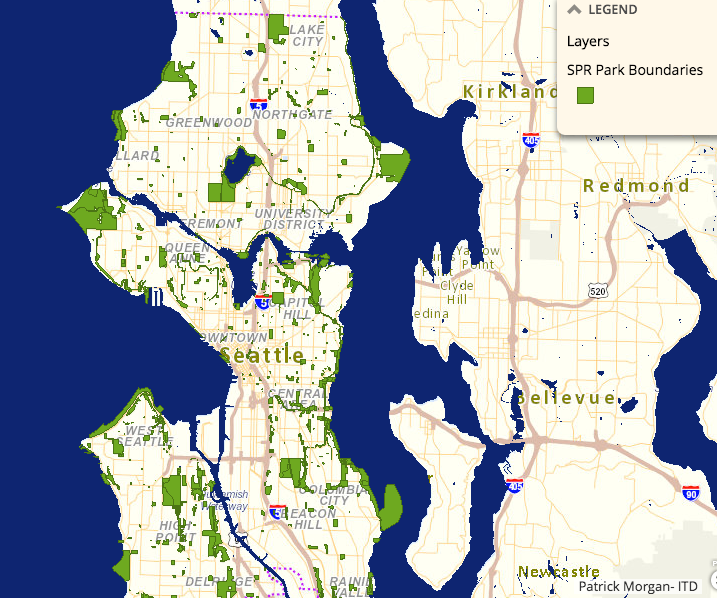
The first map looks at all of the park spaces currently owned and operated by City, which totals some 6,400+ acres of land (about 11% of the city’s total land area). What is striking in the map are large tracks of open space at the edges of waterbodies and networks of continuous open space along stream corridors and steep hillsides. Smaller parks tend to dot residential neighborhoods throughout the city, but there are obvious gaps in open spaces in portions of Southeast, Northwest, and West Seattle.
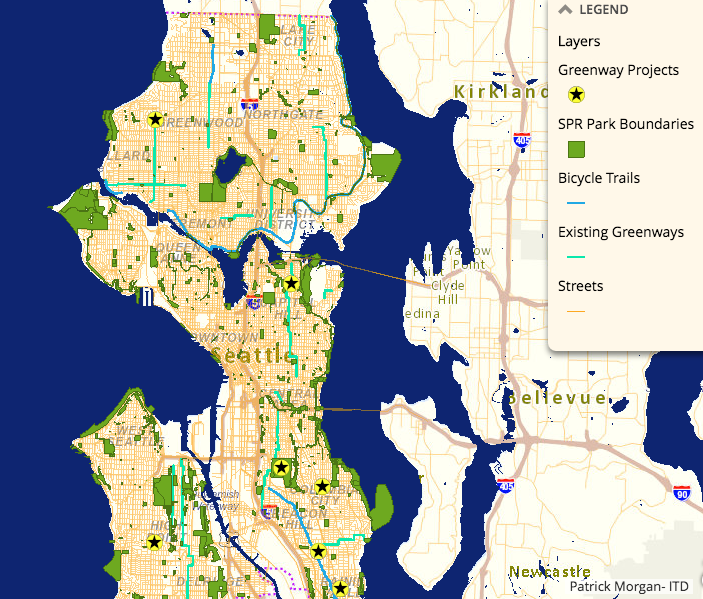
Access
The access map highlights the existing street network, bicycle trails, and Greenways (and new Greenway projects). But it shouldn’t be interpreted to mean that all streets are accessible to those on foot or with mobility challenges. The streets indicated on the map are just that: streets. As we know, much of the city lacks sidewalks in Southeast Seattle and North Seattle.
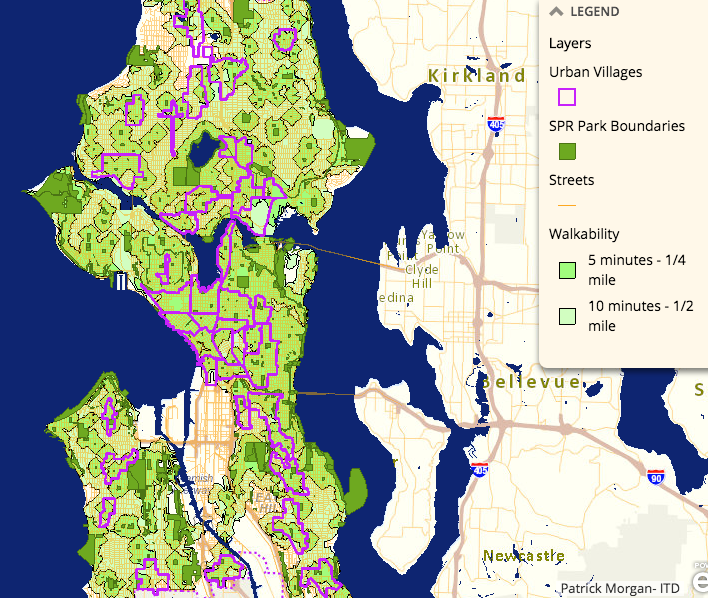
Walkability
The walkability map roughly shows walk ability in terms of quarter-mile (five-minute walk) and half-mile (10-minute walk) distances from park access points. Certain barriers like waterbodies, unconnected streets, and ravines are discounted in the walkability analysis, as are streets without sidewalks, though it doesn’t discount streets with poor accessibility. However, the map does consider access points to parks for walkability. Places like Carkeek Park in Northwest Seattle and Jackson Park in Northwest Seattle stand out as having accessibility problems for pedestrians because of barriers (I-5 in the case of Jackson Park) and lack of access points (north end of Carkeek Park).
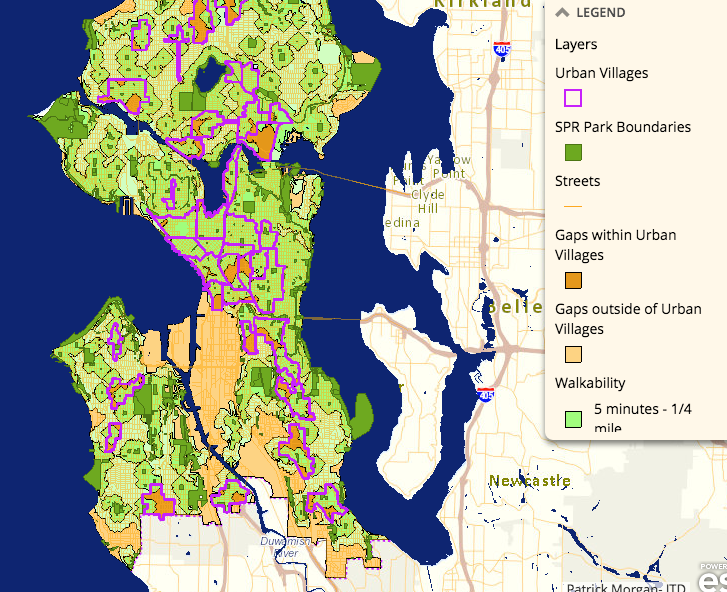
Gaps in Walkability
Building upon the walkability analysis, SPR is able to determine where obvious gaps are throughout the city. The dark orange areas are gaps within urban villages while the light orange areas are gaps outside of urban villages. The distinction can be useful in that it generally correlates with density: urban villages with higher numbers of residents and workers, and areas outside with lower shares. Traditionally, the City has set goals for the amount of park space that should be accessible to urban village areas.
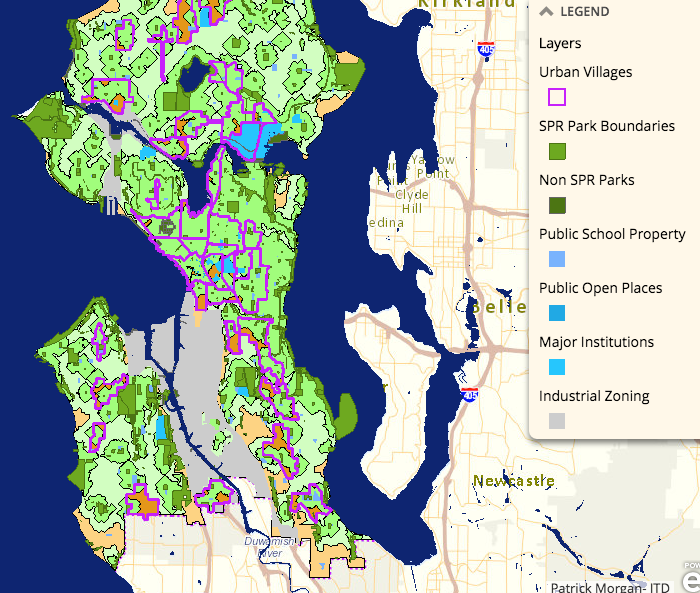
Opportunity
SPR offers another map that provides finer context for some areas of the city that have industrial zoning, and possible opportunities to access existing open space that is owned by others like public schools and major institutions.
Aside from the residential and mixed-use area of Georgetown and South Park, most of the Duwamish area is industrial–areas that may not be particularly high priorities for open space. SPR highlights the industrial zoned areas in that portion of the city in grey. Similarly, the map indicates the Ballard-Interbay Manufacturing Industrial Center in grey wherever industrial zoning is present.
Meanwhile, public open spaces, public school properties, and major institutional properties are highlighted throughout the city in differing blue tones. Many public open spaces aren’t owned and operated by SPR, but are publicly accessible. These can be privately-owned plaza spaces in Downtown that permit public access, open spaces associated with other City-owned facilities, and public spaces owned by other public agencies. In the walkability gaps map above, we see that there are large areas within the University District and Ballard that have walkability gaps to open space. But when the University of Washington and Swedish-Ballard campuses are considered, the gaps are far fewer.
The important takeaway is that by considering these contexts, open space gaps may not be as large as the gap in walkability maps suggests, and even may offer avenues for partnership in providing accessible open space.
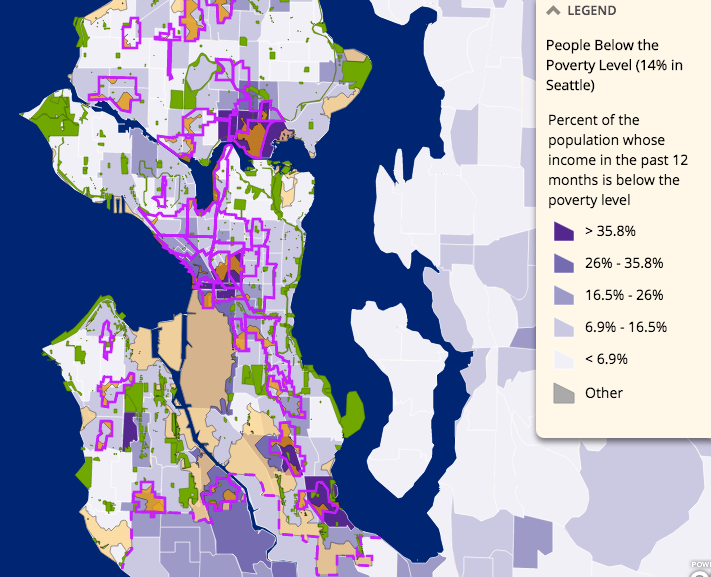
Equity
The equity map highlights the percentage of people in each census block area that are below the poverty line. In Seattle, at least 14% of residents fall below the poverty line but the distribution is not remotely equal. The darkest shades of purple reach upward of 35.8% while the lightest purple areas have shares below 6.9%. The highest rates of poverty are concentrated around the University District, Capitol Hill and First Hill, Pioneer Square, and Rainier Beach and New Holly. Layered on top of this is an analysis in open space walkability gaps. Many of the highest concentration areas of poverty also have significant gaps in walkability to open space while areas with the least amount of poverty almost universally have quality access to open space. This suggests that there may be an inequitable distribution of open space in relationship to income.
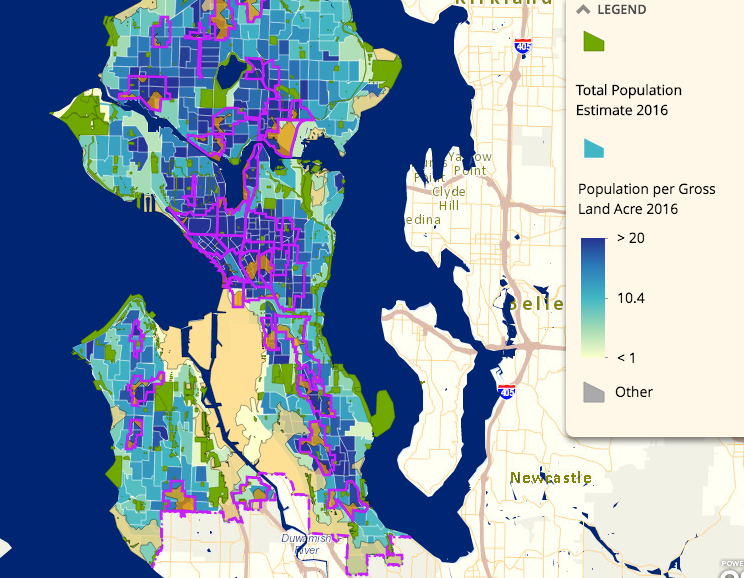
Population Density
Looking at another dimension of the spatial environment, SPR examines the relationship of population density and access to open space. While some lower density areas of the city have walkability gaps to open space, the gaps tend to be most pronounced for denser blocks.
Limitations of the Gap Analysis
The gap analysis offers a lot of information about where SPR could make improvements to lessen gaps or partner with others to provide open space, but it doesn’t necessarily tell us a lot about the qualities of park space or actual accessibility constraints.
There’s a big difference between the range of activities that spaces like Greenlake, Volunteer Park, and Cal Anderson Park offer versus spaces like Cowen Park/Ravenna Park and Genesee Park. Accessibility to many small parks is not the same as accessibility to few large parks. And there’s a difference in access to a park that is well landscaped, open and inviting, and well lit compared to a dated, hidden, and unlit one.
The gap analysis also doesn’t tell us things like the impediments of walking up and down hills to get to open space, conditions of sidewalks, where accessible routes are for those with mobility challenges, or the finer points of bikeability. All of these are important qualities to consider when conducting an analysis to develop a level of service and investment plan for community space.
These aren’t criticism of the gap analysis. SPR’s mapping work is a good first crack at the issue and provides great insights into many key issues. But as the Department moves forward, these other considerations will need further examination and buy-in from the public and policy-makers.
If you have an interest in learning more about the 2017 Parks Development Plan and the gap analysis work, SPR will have two drop-in sessions in January. The first will be on January 10th from 6pm to 8pm at Optimism Brewing on Capitol Hill, and the second will be on January 21st February 4th from 10am to noon at the Columbia City Royal Room in Columbia City. Public comment can also be submitted through March. SPR plans to finalize the 2017 Parks Development Plan in March, draft legislation in the early Summer 2017, and receive final City Council approval in September.
UPDATE (12/15/16): SPR notes that the date for the Columbia City meeting has changed to February 4th.