Three maps comparing light rail station areas create a portrait of a complex region.
Columbia City…Mount Baker….Beacon Hill…SoDo…
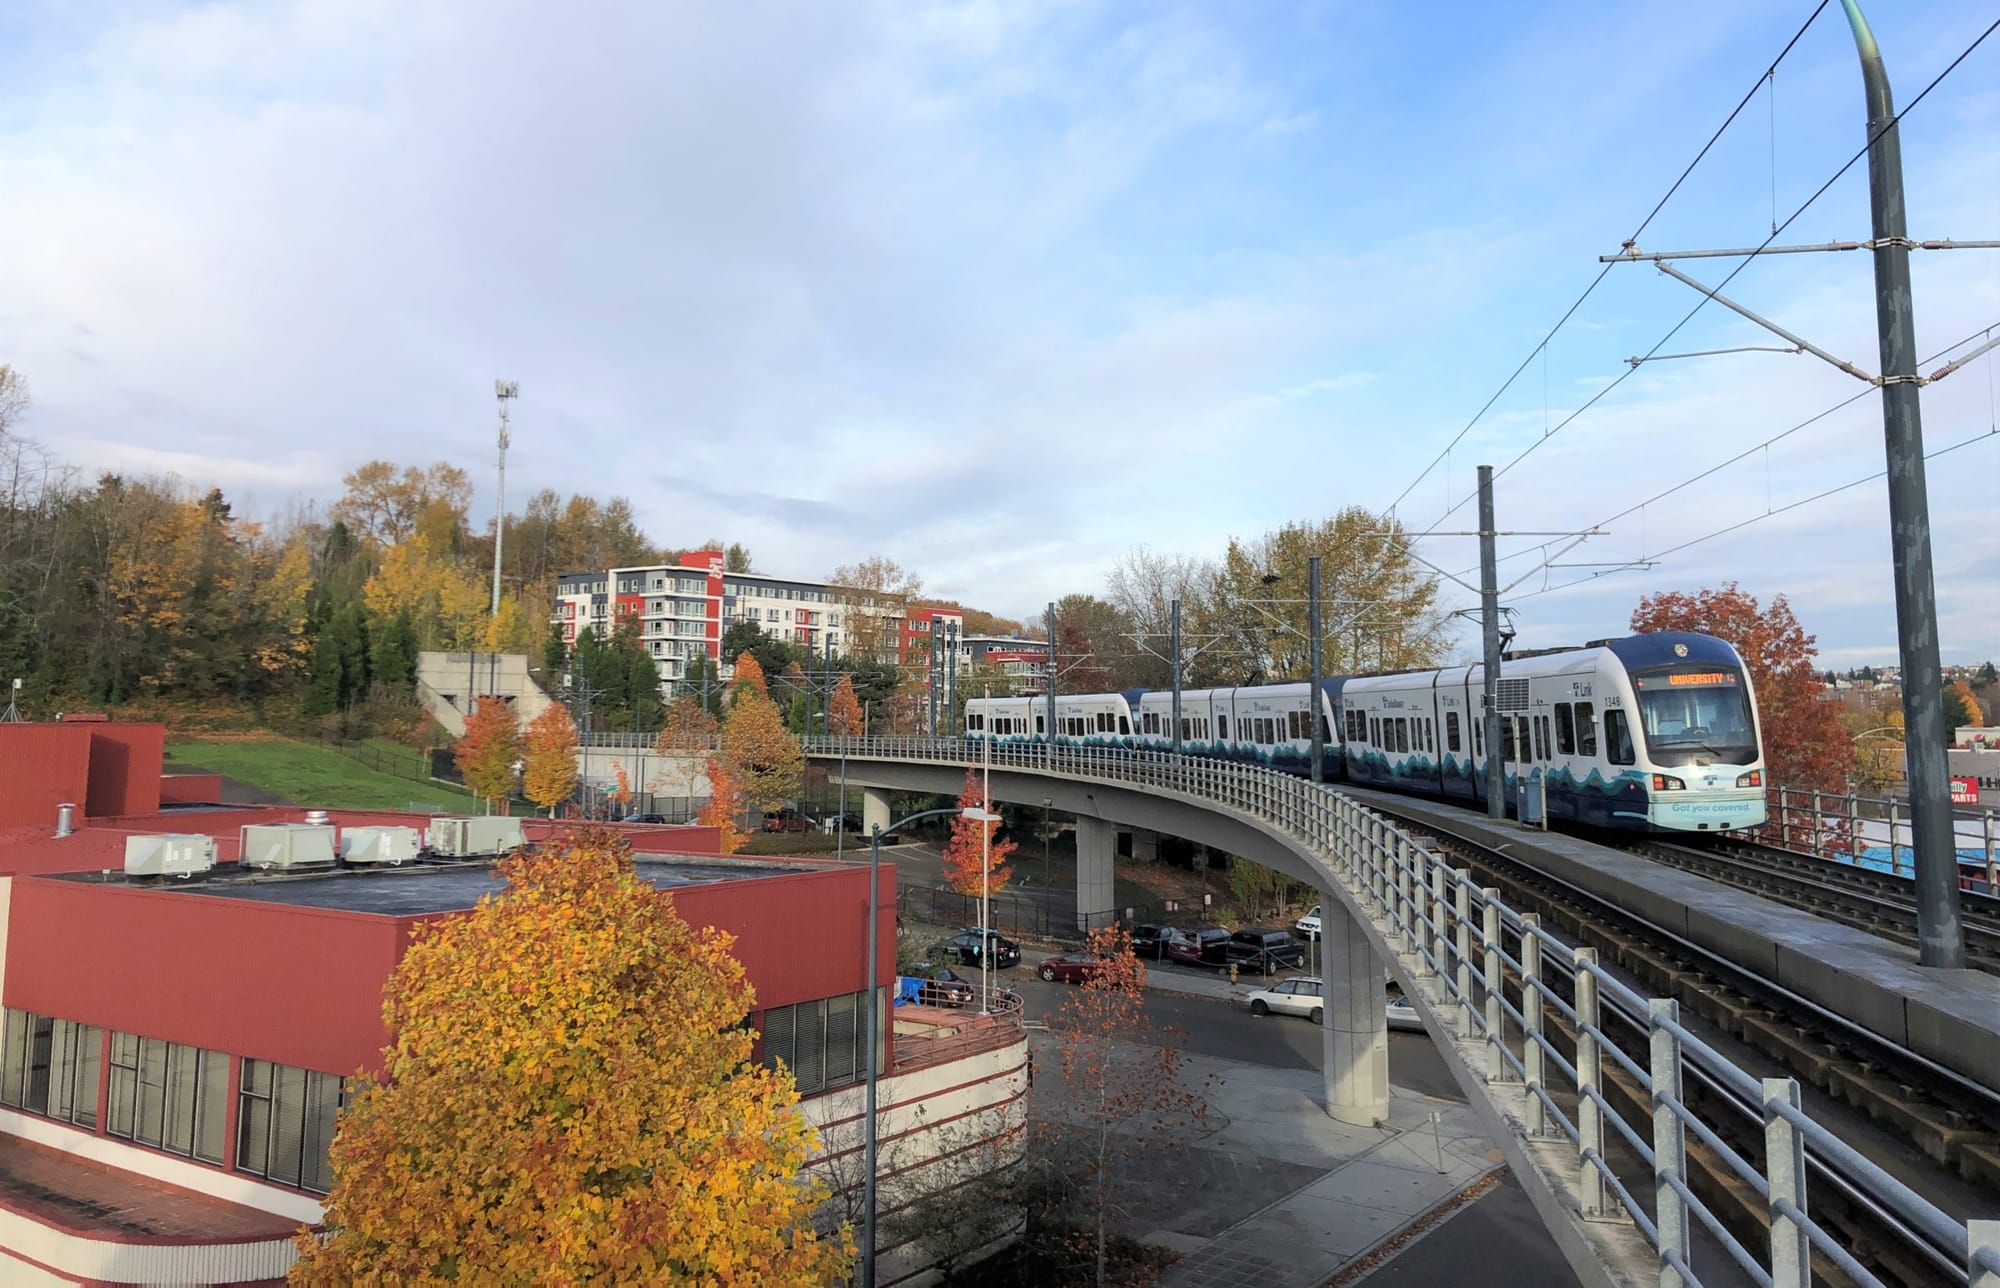
When I first arrived in Seattle, the light rail stops — and the green map showing them neatly in a line — became my foundation for understanding a new city.
From SeaTac to U District, I repeated the names of the light rail stops in my head. The light rail created my first impression of Seattle as a new resident, and over the next few weeks, it continued to be my primary connection to the rest of the city.
As the weeks passed, the green map also became a mental map of the inequality and diversity within Seattle — the neighborhoods with the fanciest restaurants, with the highest concentration of tech workers, with primarily working class families, with the most immigrants.
My work focuses on the intersection of data and storytelling. So I began to mull over a question: What if we reimagined the light rail map to capture those changes in inequality and diversity along the route?
The richest and poorest neighborhoods
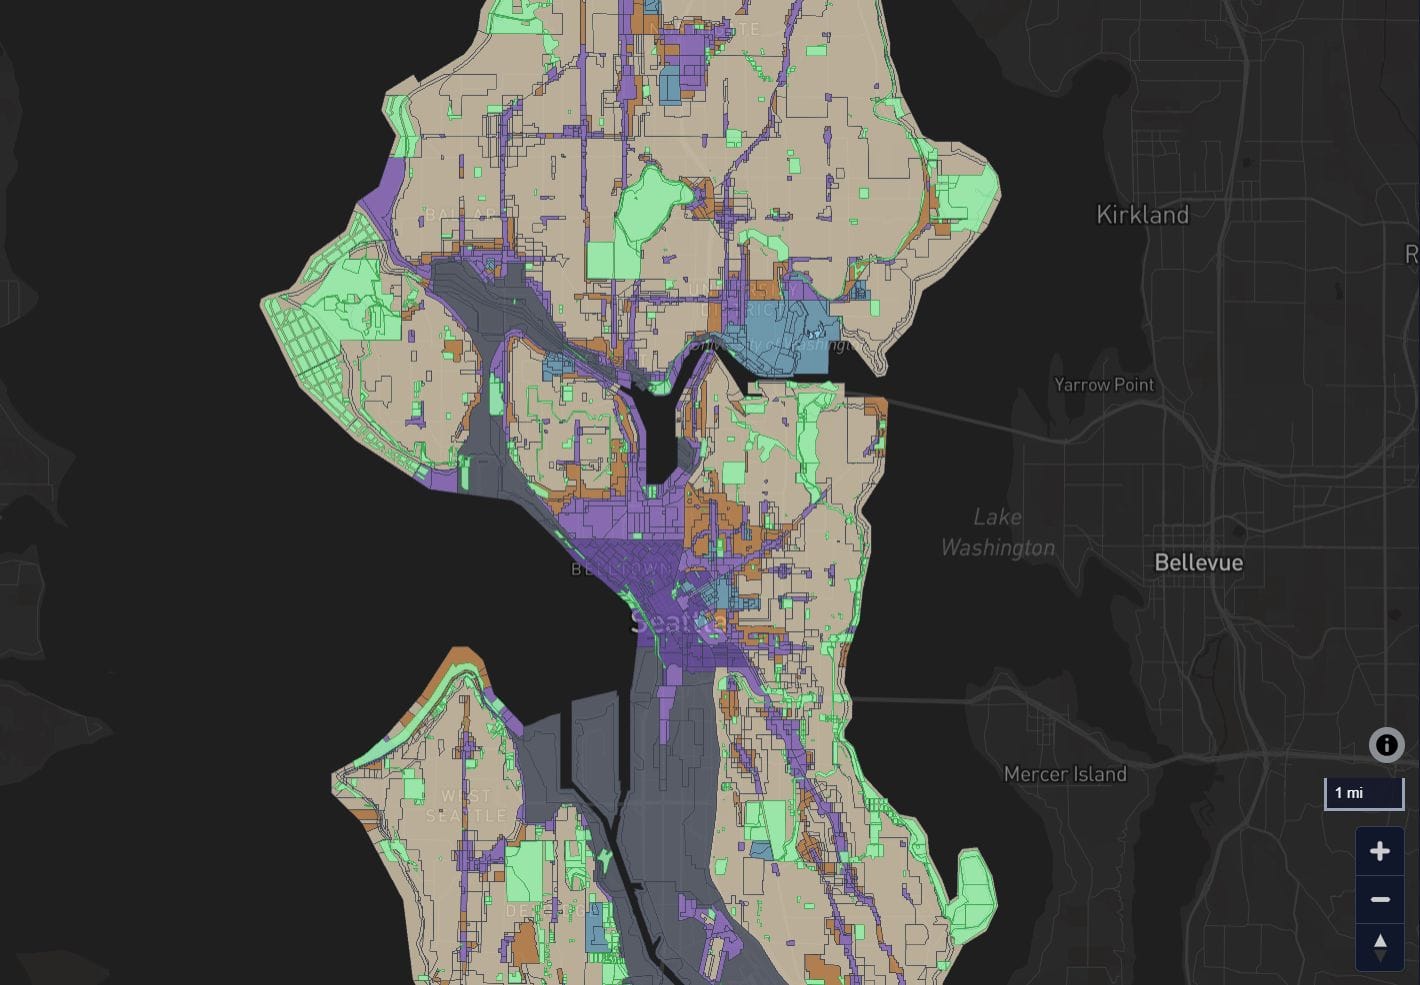
The map below shows the median household income of every neighborhood around the light rail station, using zipcode data from the Census Bureau’s American Community Survey. Each zipcode represents an area with a radius between one to five miles.
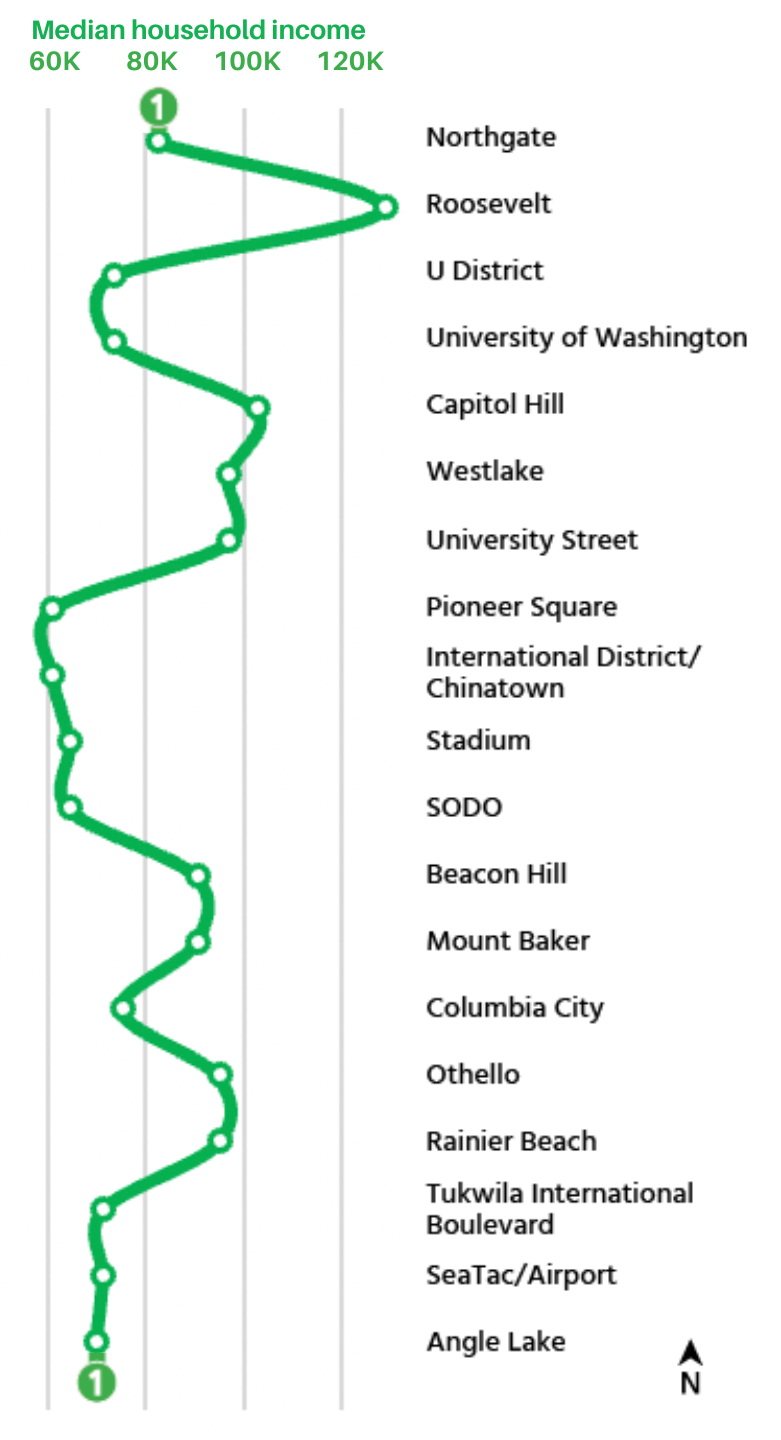
There is a wide spread of income across the 1 Line’s adjacent neighborhoods. Roosevelt’s surrounding areas have the highest median household income at $128,000, followed by Capitol Hill.
The area around Pioneer Square and International District/Chinatown have the lowest at just over $60,000. While poverty might be most visible in these areas, with encampments concentrated around downtown neighborhoods and SODO, households in neighborhoods on the southern outskirts of Seattle (Tukwila, Angle Lake) also face lower wages.
Where do people own homes?
Adding another dimension — home ownership — tells a more complete story of the living situations throughout Seattle.
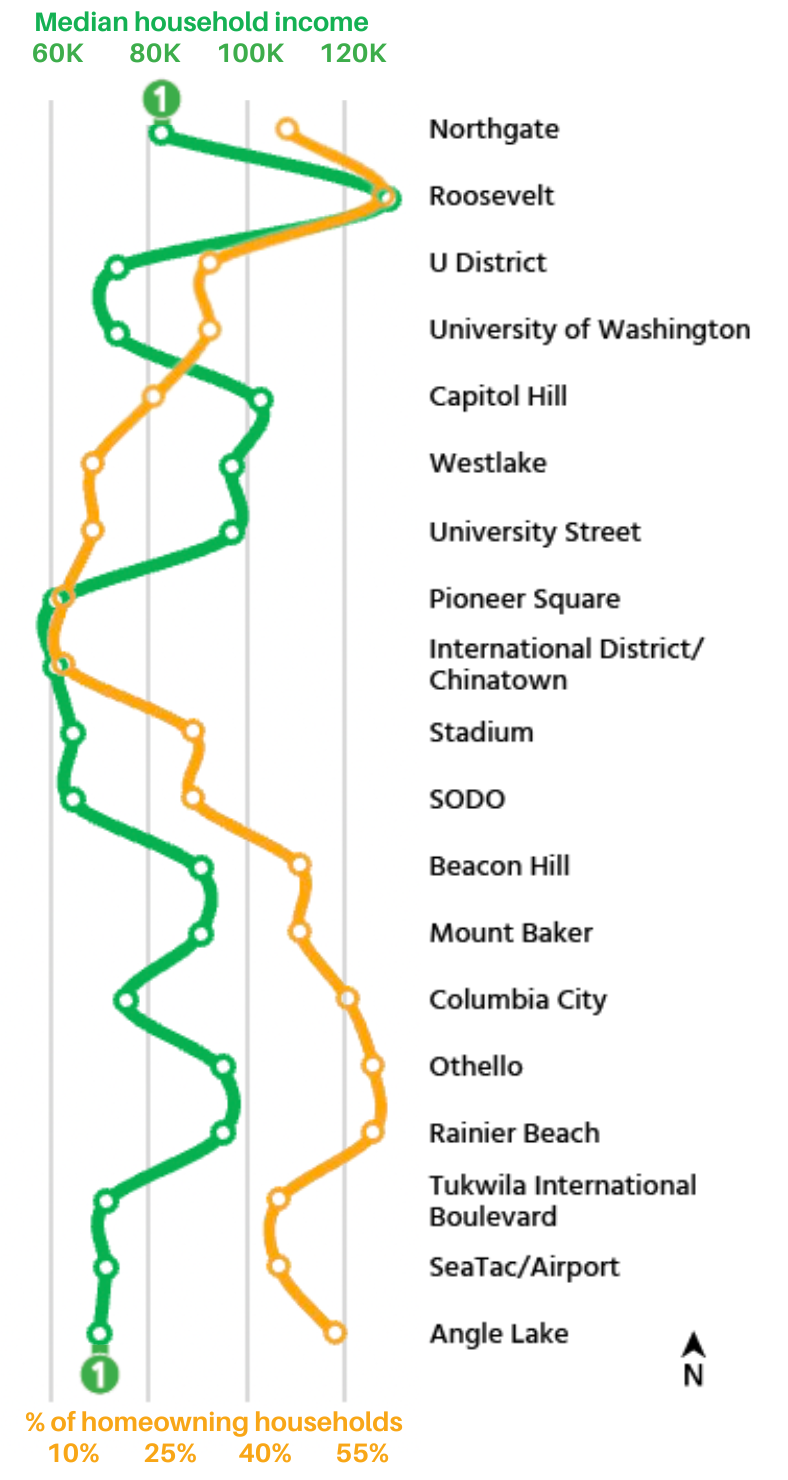
In Roosevelt, the richest neighborhood around a light rail station, homeownership is also highest (61% of households). The homeownership rate drops over the next seven light rail stops to the south, bottoming out at 10% in Pioneer Square and the International District/Chinatown. Capitol Hill and Westlake have more than three times the number of renters than owners despite higher incomes — reflective of a younger population and higher ownership costs.
Further south, more households own their homes despite lower overall incomes, reflecting a relatively more accessible housing market. Fewer apartments have been added in the walksheds of Rainier Valley light rail stations compared to stations in the downtown core and Capitol Hill.
What about race?
62% of Seattle residents identify as White and non-Hispanic. Neighborhoods across Seattle attract different demographics of residents, and race is no exception. A southbound ride on the 1 Line is also usually a ride from a Whiter neighborhood to a more racially diverse neighborhood.
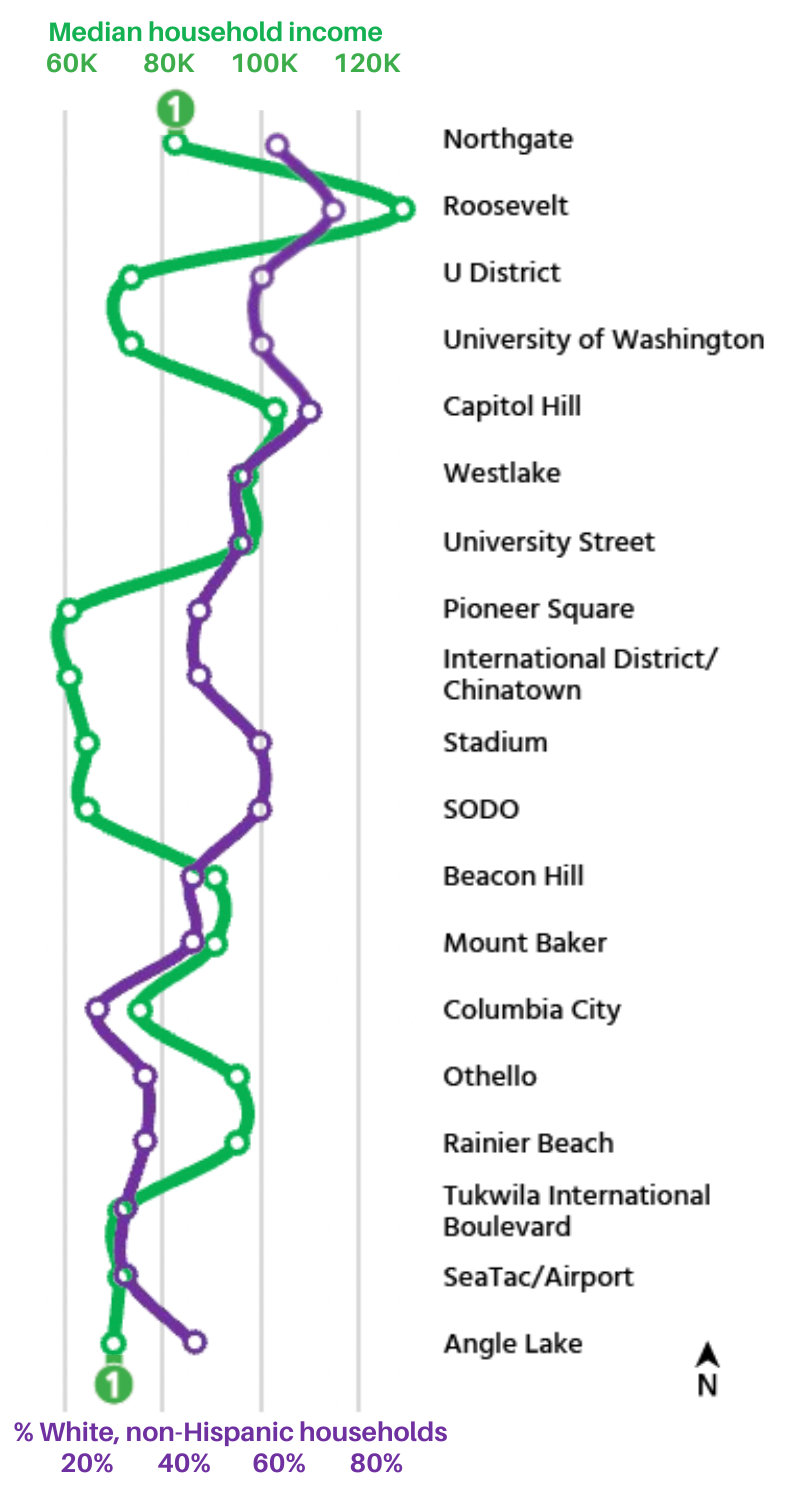
While home ownership and income fluctuate up and down along the route, race shows a relatively consistent pattern: the percentage of White non-Hispanic households decreases from around 60-70% at the northern end of the light rail to 30-40% at the south end. Today’s racial sorting is largely a holdover from redlining and racist lending practices that kept households of color out of North Seattle neighborhoods, as well as a mix of individual preferences and housing discrimination.
It doesn’t take a local to realize that tons of Seattleites live too far west or east of the 1 Line to easily access it (a separate issue), so the light rail corridor renders an imperfect representation of Seattle. But it was my first representation of the diversity across the city as a car-less new resident, and these maps capture some of the diversity — and also inequality — undergirding the city.
Sound Transit Now Has a Strategy for Bringing Retail into Stations
More Chinatown Station Ideas Floated as Sound Transit Meanders toward Decision