A hot summer day in Seattle may be scorching in the Central District, a historically Black neighborhood, while North Capitol Hill, home to many affluent White residents, catches a reprieve. Land use patterns across the city vary significantly, resulting in unequal access to climate adaptive resources such as large trees and greenspaces. Arguably, these land use patterns represent decades of disparate levels of investment linked to racist redlining policies.
As the climate warms, scientists project an increase in the intensity, duration, and frequency of heat waves throughout the Pacific Northwest. The level of threat posed by these heat waves may very well depend on your neighborhood of residence. A nationwide study of 108 urban areas revealed that historically redlined neighborhoods experienced higher temperatures compared to non-redlined neighborhoods in almost every city studied.
This presents a two-fold issue for BIPOC (Black, Indigenous, and People of Color) communities: 1) historically redlined areas have larger concentrations of BIPOC residents today compared to non-redlined areas, and 2) redlining resulted in less wealth accumulation in BIPOC communities. Consequently, BIPOC households in urban areas face a disproportionate exposure to higher temperatures and have fewer financial resources to adapt to the harshening climate.
What is Redlining?
Redlining refers to racist and discriminatory housing policies brought forth by the federal government in the wake of the Great Depression and during the New Deal Era. The Home Owners Loan Corporation (HOLC) drew color-coded maps of hundreds of cities across the US, including Seattle, Tacoma, and Spokane. Based on the racial composition of an area, these maps determined which neighborhoods were eligible to receive financial services such as mortgages and insurance loans.
Black neighborhoods and those adjacent were coded red (high risk) and yellow (moderate risk). Bank investments were guided by the HOLC maps effectively excluding generations of Black and other households of color from homeownership at a time when housing was relatively more affordable. This barred Black, Indigenous, and People of Color (BIPOC) communities from engaging in the most effective mechanism for wealth building in the US: homeownership. While the use of redlining maps legally ended in 1968 with the Fair Housing Act, the impacts persist both through the built environment and within the communities excluded from wealth generation.
A 1975 study by the Central Seattle Community Council Federation revealed how disinvestment in redlined areas was the root cause of the decline of the Central District. Disinvestment occurs when municipalities, developers, or banks deprive neighborhoods of improvement and other resources. A common result of disinvestment is less tree canopy, less access to parks and greenspaces, and greater proximity to polluting industries, all of which contribute to heat-trapping conditions.
A recent study found that redlining and other racially-restrictive housing practices robbed BIPOC households in King County of between $12 billion and $34 billion, not just realized through home value appreciation over time, but also rental payments that never turned into wealth, and wealth lost to lower home value appreciations for BIPOC-owned homes compared to White-owned homes. This loss of wealth can further expose people to extreme heat if they don’t have access to air conditioning units or the ability to take time off if they work outside, for example.
Urban Heat Island Effect and Intra-Urban Heat
The Urban Heat Island effect refers to how urban areas tend to have higher ambient temperatures than suburban or rural areas in the same region. The primary reason for this is because dense urban areas have higher concentration of built surfaces and fewer natural spaces with vegetation. Intra-urban heat variation is a less studied phenomenon and refers to how temperatures can vary greatly within a city. This temperature difference can vary as much as 18°F (or 10°C) in a single city. People who reside in hotter areas are more susceptible to health challenges and even fatalities during heat waves.
Correlation Between Heat and Redlining Grade
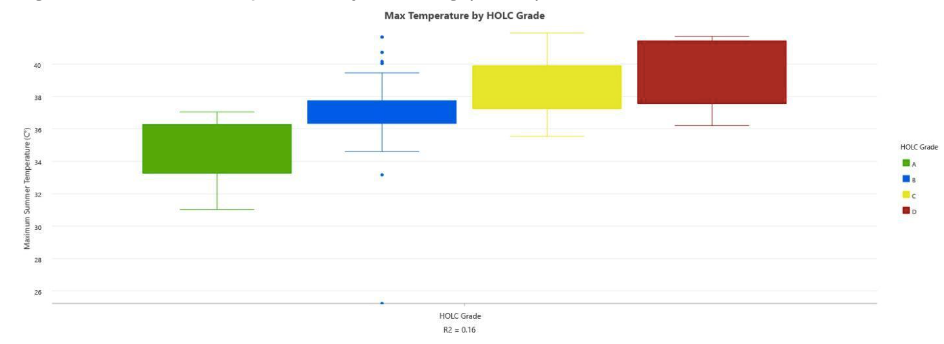
The box-plot below shows the positive correlation between Seattle’s historic redlining grade (HOLC grade) and maximum summertime temperature. Areas that were historically redlined are more likely to experience higher temperatures today.
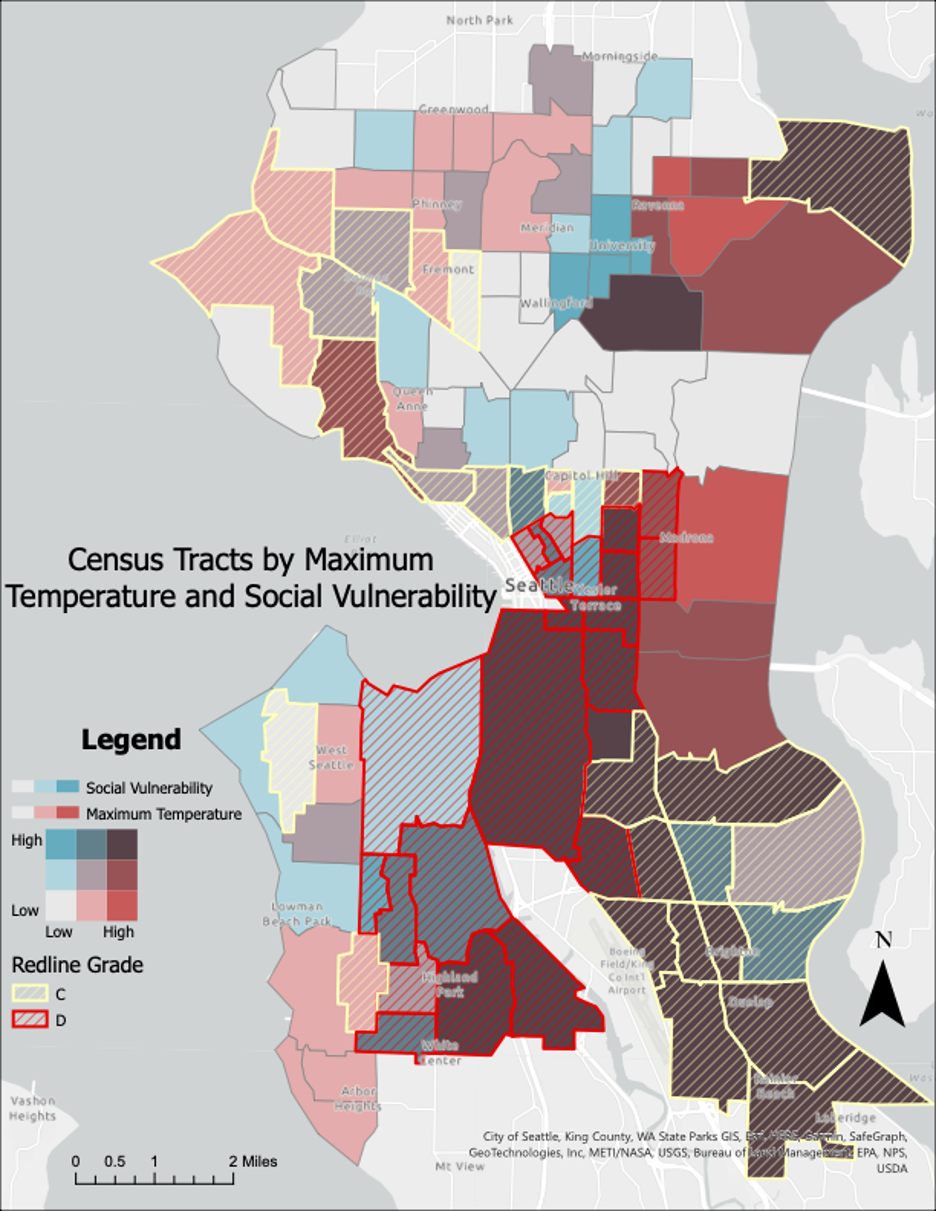
The map below represents census tracts by maximum temperature, social vulnerability, and redlining grade. The darker shading indicates census tracts high in both maximum temperature and social vulnerability. All but two of these census tracts were historically redlined. Redlining grade is represented by yellow and red crosshatching. The areas that are high in social vulnerability and maximum temperature should be prioritized for investments in community-led climate adaptation and mitigation activities.
Tree Canopy and Impervious Land Surface
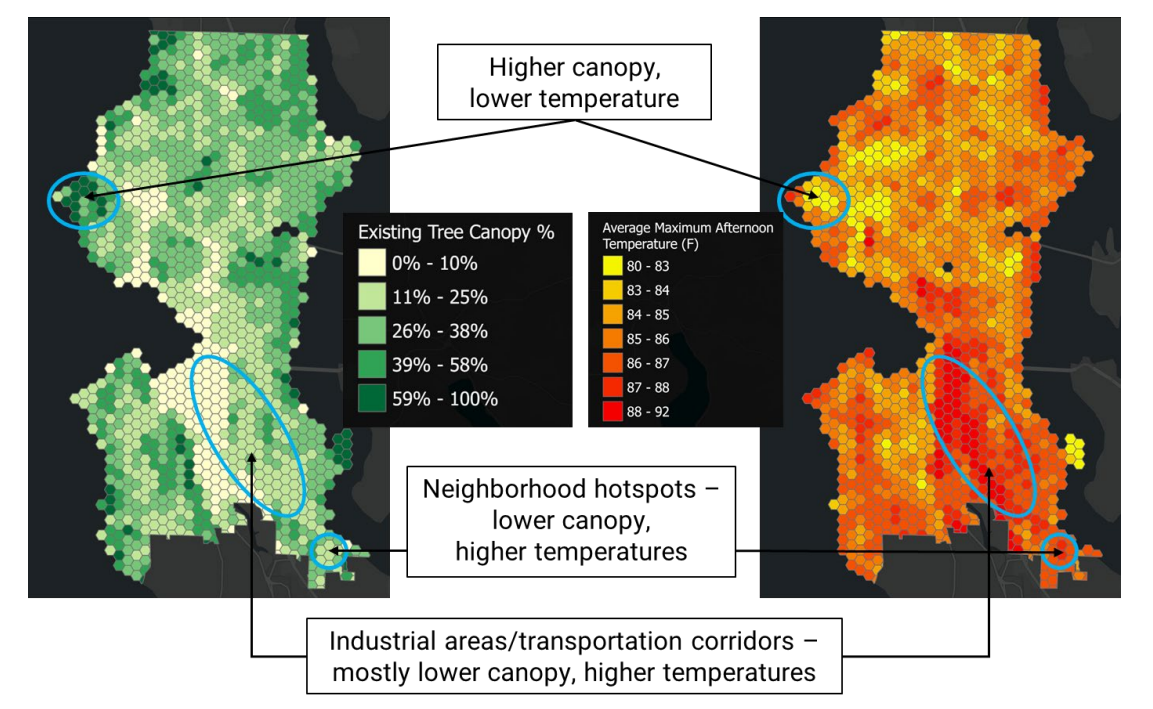
There is visibly less tree canopy coverage in the Duwamish Valley and the International District; both areas that were extensively redlined. Impervious land cover (e.g., buildings and asphalt) absorb radiant heat leading to increased temperatures, while pervious landscapes with more vegetation lead to lower temperatures. This relationship is demonstrated in the graphics below. According to the 2021 Tree Canopy Assessment, higher tree canopy coverage can provide crucial climate infrastructure and mitigate extreme heat. This report also shows how neighborhoods that were redlined had fewer trees to begin with, and now are losing tree canopy faster than the citywide average.
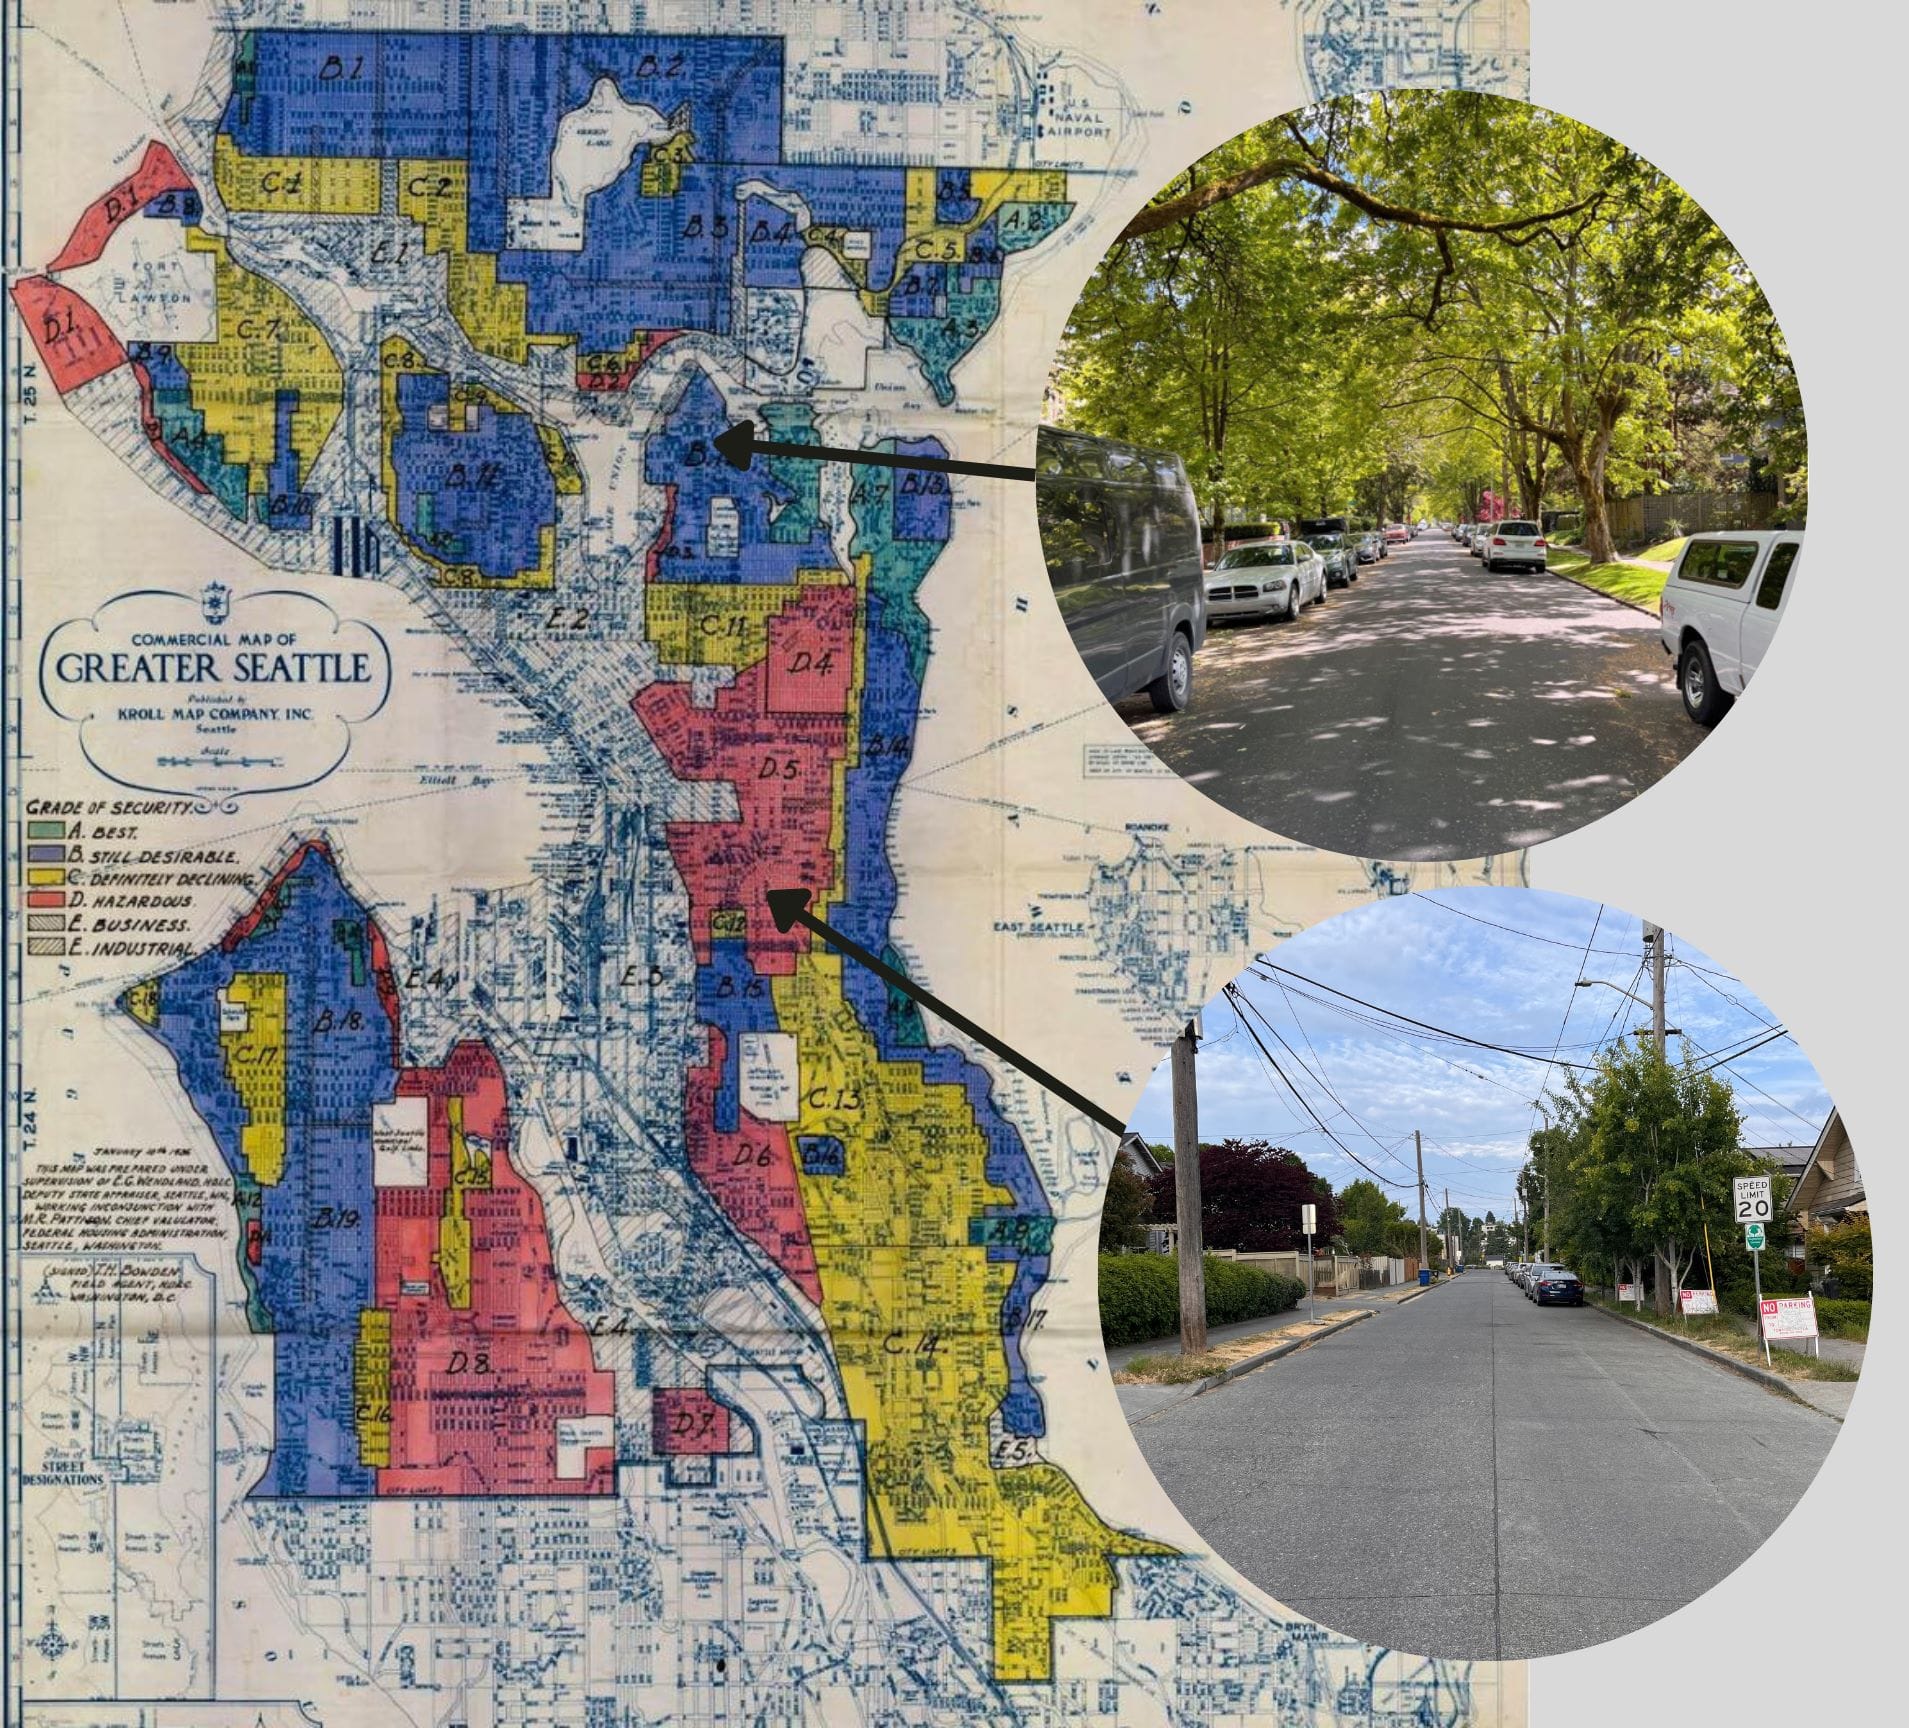
The graphic below shows how two residential streets can vary in tree canopy coverage. The top photo is a non-redlined, affluent neighborhood with streets lined with larger and older trees. The bottom photo shows a historically redlined neighborhood, still home to lower-income communities of color, that has far fewer trees, and no large, older trees.
In the 1950s the federal government funded major highway expansion projects. The construction of these highways often occurred in the lowest income neighborhoods of cities, disproportionately impacting communities of color. Not only does this disrupt, divide, and transform the physical, social, and cultural fabric of these neighborhoods, it also contributes to air pollution and the amount of impervious land surface, again making these areas more prone to higher summertime temperatures. A study of Seattle’s 1923 zoning code reveals that areas where Black or Chinese-American families resided were significantly more likely to receive commercial zoning, which also has higher concentrations of impervious land surfaces.
After Jim Crow Laws were deemed illegal in 1917, planners began using another tactic to sustain racial segregation in cities: single-family zoning. Harlan Bartholomew, known as the “father of urban planning,” was hired by the City of Seattle to consult on their first zoning ordinance. Bartholomew had stated that single-family zoning was his strategy to “preserve the more desirable residential neighborhoods,” and to prevent movement into “finer residential districts…by colored people.”
While not explicitly racist, single-family zoning has covert racial exclusion baked into it. It continues to be widely used and in many neighborhoods throughout Seattle preserves White, higher-income enclaves. By restricting housing density and housing type, housing costs arbitrarily increase and become unaffordable to BIPOC, namely Black residents who are disproportionately low-income.
The City of Seattle renamed their single-family zones to “Neighborhood Residential” zones in 2021. Neighborhood residential zones make up about 39% of Seattle’s land mass, which is the largest zone by size. Within these zones, nearly half of the city’s tree canopy exists. This compares to just 6% of the City’s tree canopy coverage existing in Multifamily zones. Due to exclusionary zoning and other economic systems of oppression, there are higher concentrations of BIPOC residents in Multifamily zones compared to Neighborhood Residential zones.
Moving Forward
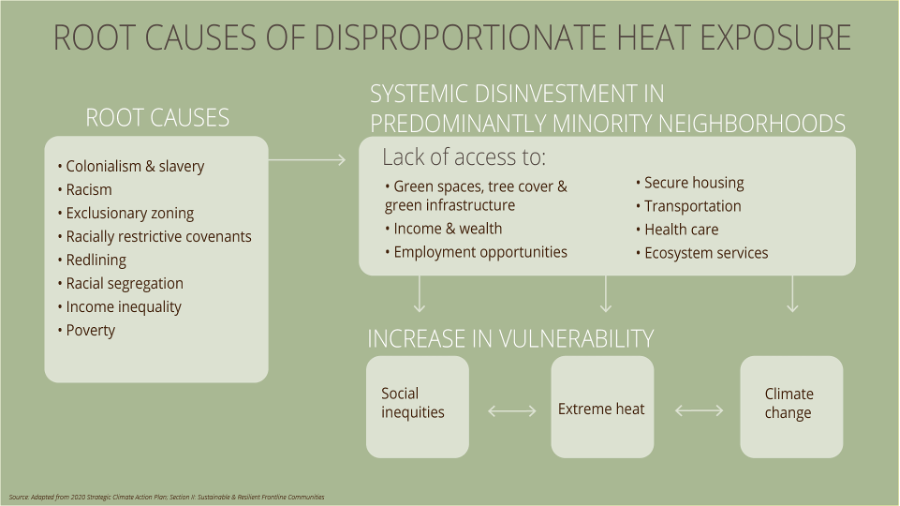
Multi-pronged work needs to happen on many different levels of government, community-based organizations, local agencies, and the like, to address the widespread impact that redlining and other racist and exclusionary practices have had on BIPOC communities. To build heat resilience before future heat waves, actions must be taken to mitigate and adapt to extreme heat, as well as to address the root causes of the disproportionate exposure to extreme heat. As the diagram below illustrates, racism is a root cause of disproportionate heat exposure. Investments should be made in communities who are most impacted by these injustices so they can devise holistic solutions to them.
Seattle and Washington State are working toward addressing some of these issues by launching the Washington Tree Equity Collaborative, to increase neighborhood tree canopy in low-canopy neighborhoods. Building resilience in the face of future heat waves, and decreasing environmental health disparities, are two main goals of this partnership. It’s important that communities living in low-canopy neighborhoods play a primary role in identifying how and where canopy is increased, so it doesn’t overshadow other pressing development needs such as affordable housing.
San Francisco is taking bold steps in addressing their history of redlining and the gentrification and wealth stratification that it precipitated. City leaders are currently considering 111 recommendations that their reparations task force set forth to close the racial wealth gap and to bring displaced Black residents back to the City. These recommendations include up to $5 million in cash payments and housing aid per household to anyone eligible. The City of Seattle should consider ways in which it can pay reparations to their current and former Black residents who were and continue to be victims of redlining.
Efforts such as these come from decades of community organizing and advocacy. Even though frontline communities and those overburdened by systems of oppression have demonstrated admirable resilience and community care when government failed them, they should not have to bear the heavy burden of it alone. Through investment, power sharing, and collaboration, municipalities can address the harms they imposed on communities of color, and together, build holistic climate resilience.
This article was a student showcase based on a thesis. Have your own research to share? Pitch us! Details here.