
The Seattle Office of Housing is set provide a progress report on the Multi-Family Tax Exemption (MFTE) program to the Affordable Housing, Neighborhoods, and Finance Committee this morning. The report is part of a thrice annual update to the City Council on the MFTE program. This will be the first report since Council reauthorized the MFTE program in September and made significant changes to how it operates.
The MFTE program is one of the primary tools that the City has to provide affordable housing options. Importantly, the MFTE program is supplied by units allocated voluntarily by developers from new development. Tax exemptions for up to 12 years are offered to multi-family property owners in exchange for a minimum of units are set aside for income- and rent-restricted households. The program has established eligibility areas to include any property zoned for multi-family residential. Property owners must agree to provide at least 20% of the units in a development as affordable, as outlined in the Table 11.
Table 1: 2015 MFTE Program Breakdown
| Unit Type | Area Median Income Cap | Maximum Rent | Maximum Income |
|---|---|---|---|
| SEDU/Congregate | 40% | $503 | $25,120 (1-person household) |
| Studio | 65% | $895 | $40,820 (1-person household) |
| 1 Bedroom | 75% | $1,219 | $53,775 (2-person household) |
| 2 Bedroom | 85% | $1,539 | $68,595 (3-person household) |
| 3 Bedroom | 90% | $1,827 | $80,640 (4-person household) |
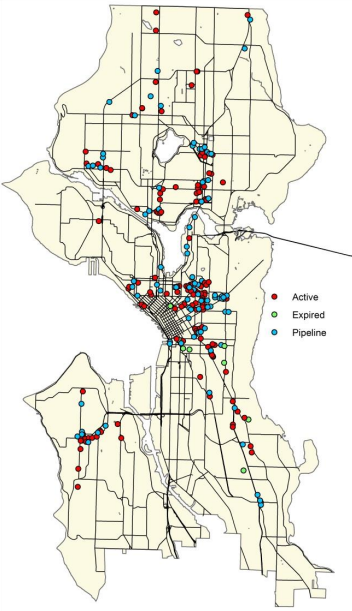
The City currently has 3,963 units participating in the MFTE program. With 90 projects in the pipeline, another 2,124 units have been approved and could be brought to market over the next few years. The Office of Housing anticipates that more than 6,000 units will provide affordable housing as part of the MFTE program by 2018. That’s not a lofty goal given the rate of current production in the development pipeline.
The lion’s share of new affordable MFTE housing is poised to be located throughout major urban centers and urban villages like Capitol Hill, Roosevelt, Ballard, and the Admiral District (as indicated by blue dots on the map). That’s not exactly a surprising result since those areas have been experiencing substantial housing growth over the past few years. Still, the strongest presence of affordable units is likely to be situated toward the city core and select areas in North Seattle.
Coupled with the new MFTE units in the pipeline is a further 7,331 market rate units that will come online over the same period. The average unit share of affordable housing to market rate housing in MFTE developments breaks down to approximately 22.4% affordable and 77.6% market rate, respectively. This suggests that most MFTE developments are modestly exceeding the City’s minimum target of 20% affordable units.
The largest share of affordable housing units in the pipeline are studios and one-bedrooms, which make up nearly 80% of the new MFTE units coming online. Only a small sliver — 1% — of new units will serve the needs of larger families, which is why the Council revised the MFTE program last fall to give more carrots for larger units like three-bedrooms.
Table 2: MFTE Third Trimester 2015 Report
| Active | Pipeline | Active + Pipeline | Expired | Withdrawn | |
|---|---|---|---|---|---|
| Total Projects | 131 | 93 | 224 | 9 | 10 |
| All Affordable Units | 3,963 | 2,124 | 6,087 | 241 | 244 |
| All Total Units | 13,732 | 9,455 | 23,187 | 530 | 1,176 |
| SEDU Affordable Units | Nil | 7 | 7 | Nil | Nil |
| Studio Affordable | 1,205 | 776 | 1,981 | 62 | 81 |
| 1 Bedroom Affordable | 1,879 | 975 | 2,854 | 108 | 123 |
| 2 Bedroom Affordable | 805 | 335 | 1,140 | 49 | 40 |
| 3 Bedroom Affordable | 68 | 23 | 91 | 22 | Nil |
| TRAO 50% AMI Units | 6 | 5 | 11 | Nil | Nil |
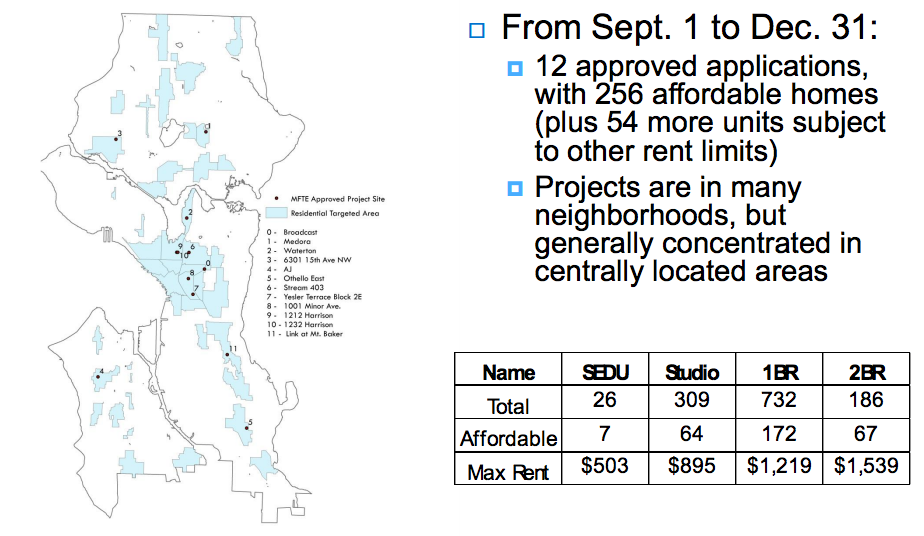
In last third of the year, the City saw 12 major development applications approved with voluntary contributions to the MFTE program. Most of these were concentrated in the central urban core of Seattle with only two location in Southeast Seattle, one in West Seattle, and another two in North Seattle. Together, these projects could deliver 310 rent-restricted housing units (256 will be rented under affordable housing terms). More than two-thirds of the units will be suitable small households (two or fewer persons), and a further 21%+ will provide housing for medium-sized families. The City also saw the first set of Small Efficiency Dwelling Units (SEDUs) approved as part of the MFTE program with 7 set to become affordable at rents no more than $503 per month.
The number of MFTE units approved at the end of 2015 is not inconsequential. In just that four-month window, the City managed to net the equivalent of almost 8% of the entire existing MFTE housing stock through development approvals. Put another way, if the rate of MFTE approvals and production were to hold steady, the City could net more than 11,000 affordable units through the MFTE program over the next 12 years. But given the cyclical nature of the building industry, that strong showing of new affordable housing agreements is unlikely to keep pace. And perhaps more importantly, the building process often takes a few years from development approval to final occupancy. Still, it’s an encouraging metric given that Mayor Ed Murray has a goal of producing 20,000 affordable housing units over the next ten years.
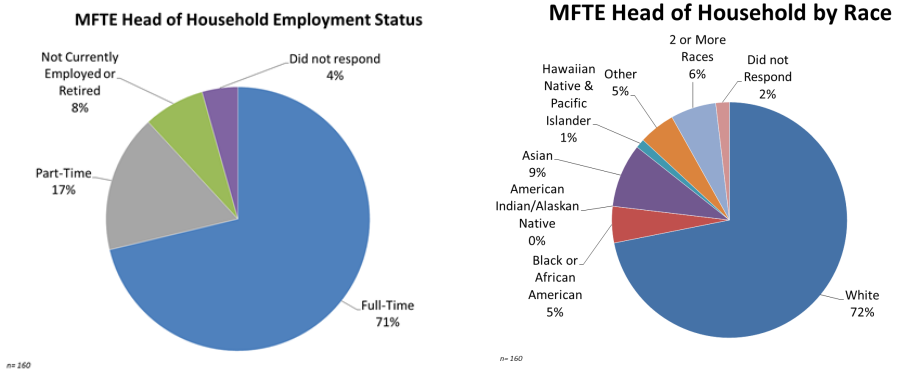
The Office of Housing also plans to release their most recent survey of participants in the MFTE program. Heads of household by and large are caucasian and employed full-time; more than 70% of all respondents fell into one or both categories. A further 17% of respondents said that they worked part-time with only 8% of participants saying that they were either unemployed or retired. Persons of color accounted for more than a quarter of respondents with Asian-Americans and African-Americans making up the largest racial groups. The Office of Housing says that the MFTE program is serving persons of color roughly proportional to the number of renters of color citywide.
Footnotes
- Table 1 shows maximum rents for units excluding utilities. Many rental units unbundle utility fees from rent. The maximum income numbers derived from the Office of Housing presentation. The Office of Housing also has a comprehensive set of rent and maximum income tables from 2015.

Stephen is a professional urban planner in Puget Sound with a passion for sustainable, livable, and diverse cities. He is especially interested in how policies, regulations, and programs can promote positive outcomes for communities. With stints in great cities like Bellingham and Cork, Stephen currently lives in Seattle. He primarily covers land use and transportation issues and has been with The Urbanist since 2014.