Seattle, King County, and Washington State growth rates all stabilized for the last year of this long decade.
The Office of Financial Management’s (OFM) April 1st population estimates are the first survey of 2019’s population in Washington’s counties and cities. Last year the OFM’s Seattle population estimate provided the first direct evidence of demand-side effects seen in flattening rents and home prices while later surveys fingered stalled employment at Amazon’s corporate headquarters going back to September 2017.
Here are the topline numbers from this year’s release:
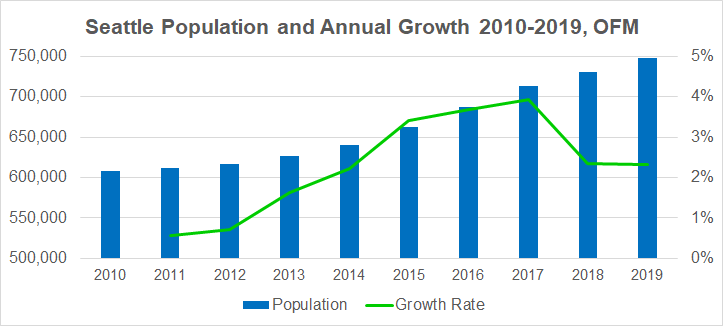
- Seattle population increased by 2.3% from last year’s survey to 747,300, an unchanged rate from the year before.
- King County population increased by 1.6% from last year’s survey to 2,226,300, a rounding error lower than last year’s 1.7%.
- State of Washington population also increased by 1.6% from last year’s survey to 7,546,410, an unchanged rate from the year before.
By comparison, the United States registers annual population growth between 0.6% and 1% for most of the last two decades while the world grew between 1.3% and 1% for the same period. Both rates have fallen since the start of the new century.
The population growth rates at each Seattle, King County, and the state level are notable for their stability, especially for Seattle. Seattle had close to no growth for the first couple years of the decade before becoming one of the fastest growing large cities in the country in the middle-part of the decade, and then a rapid deceleration of growth rate (from 3.9% to 2.3%, per OFM) at the end of the decade.
Nevertheless, Seattle may yet still finish out the decade ahead of Austin, Texas, its closest competition as far as fast-growing American cities is concerned. Those two cities’ tech industry-driven growth is just as much a reflection of our present decade as the last decade’s fastest growing large cities — Ft. Worth, Charlotte, and Las Vegas — reflected the war, banking, and real estate sectors, respectively, that defined that decade.
There are, also, intra-state patterns revealed in the 2019 OFM figures. But the east-west and urban-rural divides are not among them. Of the 22 counties with populations over 50,000, Whatcom, Franklin, and Benton had the fastest growth (2.3%, 2.3%, and 2.2% growth, respectively). Whatcom is proportionally gaining significantly more people aged 70 and up than the state; Franklin, more people 45-69; while Benton doesn’t show much deviation from the state’s age demographic changes.
Franklin and Benton border each other around where the Columbia River meets the Snake River in Southeast Washington. And here we do see something interesting because the two counties that had the slowest growth rate from the 2018 survey are Walla Walla to the east and Yakima to the west (0.6% growth each). Are these phenomena related? The OFM survey doesn’t expose that level of detail.
Grays Harbor in Southwest Washington was the third slowest growing 50,000+ person county over the last year (0.9%), once again challenging the idea of uneven population growth divided by the Cascade Range.
Overall, the counties west of the Cascade Range grew at the same rate as the state as-a-whole this year, and only slightly faster over the decade (12.5% versus 12.2%; take out Seattle and it’s the reverse: 11.4% versus 12.2%).
The collapse of an east-west population growth divide shows up at the city level, too. The slowest growing cities were Yakima, Burien, and Federal Way (0.3%, 0.3%, and 0.4%, respectively) while the fastest growing cities were Redmond, Richland, and Seattle (2.8%, 2.8%, and 2.3%, respectively).
Returning to Seattle but zooming out to the metro region, Pierce County and Snohomish County had nearly the same growth rate over the last year (1.8% and 1.7%, respectively) but Snohomish grew more than Pierce over the decade (14.8 and 11.7%, respectively). Kitsap County grew less over both timeframes (1.1% and 7.6%). The fast ferry did not swamp that county with Seattle commuters it appears. All, however, grew less than the 15.3% King County grew over the decade.
Looking back at the last OFM population survey of the 2010s, we see the spike of growth centered around Seattle falling back towards the state average. There are still patterns at smaller levels in the OFM data but they don’t validate the east-west or urban-rural divide that characterizes much geographically-conscious state and national political and cultural analysis. If anything, the story of population change in Washington State from 2010 to 2019 is still the Seattle boom, primarily driven by Amazon employment growth, just a little less dramatic at the end.
| Cities over 50,000 | 2010-2019 Percentage Change in Population Excluding Annexation | 2019 Population |
| Seattle | 22.78 | 747,300 |
| Pasco | 21.63 | 75,290 |
| Redmond | 21.03 | 65,860 |
| Lacey | 20.44 | 51,270 |
| Richland | 17.67 | 56,850 |
| Kirkland | 17.09 | 88,940 |
| Auburn | 16.44 | 81,720 |
| Sammamish | 15.43 | 64,410 |
| Renton | 14.23 | 104,700 |
| Bellevue | 14.14 | 145,300 |
| Burien | 13.19 | 52,000 |
| Kennewick | 13.08 | 83,670 |
| Marysville | 13.00 | 67,820 |
| Kent | 12.91 | 129,800 |
| Incorporated cities and towns | 12.82 | 4,910,909 |
| State Total | 12.22 | 7,546,410 |
| Olympia | 12.21 | 52,770 |
| Bellingham | 10.96 | 90,110 |
| Vancouver | 10.74 | 185,300 |
| Federal Way | 9.56 | 97,480 |
| Everett | 8.52 | 111,800 |
| Spokane Valley | 7.76 | 96,720 |
| Tacoma | 6.55 | 211,400 |
| Shoreline | 6.34 | 56,370 |
| Spokane | 5.71 | 222,000 |
| Yakima | 3.53 | 94,440 |
| Lakewood | 2.59 | 59,670 |