Seattle rents appeared to have flattened beginning late last year. Since then, as subsequent rent surveys strengthened the pattern, the consistent explanation has been the tremendous amount of new housing units built in Seattle. But the latest estimate of the city’s population complicates that story.
For advocates of supply-side housing policy, recent rent surveys are the overdue evidence that a building boom in market-rate apartments would reverse or, at least, substantially slow rent increases driven by rapid growth in population and incomes. After several false–starts mistaking seasonal variation in rents for a long-term trend, rents really do appear to be leveling off following years of historic rent increases. Here’s how several media outlets covered the news, for example:
“Analysts have pointed to a wave of new apartments opening since 2014; a record number of new units opened last year in Seattle, and even more are expected this year.” Seattle Times, April 10, 2018
“‘Because we’ve seen such a substantial amount of new supply, it’s become remarkably competitive, far more competitive since before the recession,’ [Matthew Gardner, chief economist at Windermere] said.” Q13 Fox, June 25, 2018
“The slowdown comes as the number of new apartments opening across the area has hit record levels and has begun to significantly outpace the number of new renters.” Seattle Times, January 12, 2018
“As home prices continue to skyrocket, apartment rents are starting to level off after years of record-level construction.” GeekWire, May 29, 2018
The supply-side success story relies on two pieces of data: the 10,147 new units of housing that the Seattle permit office finalized for the year 2017 and the July 2017 Census population survey, which showed growth effectively unchanged from the year before at about 2.9%. The population figures aren’t always explicitly mentioned but they are implied: despite great demand, great supply is holding down rents.
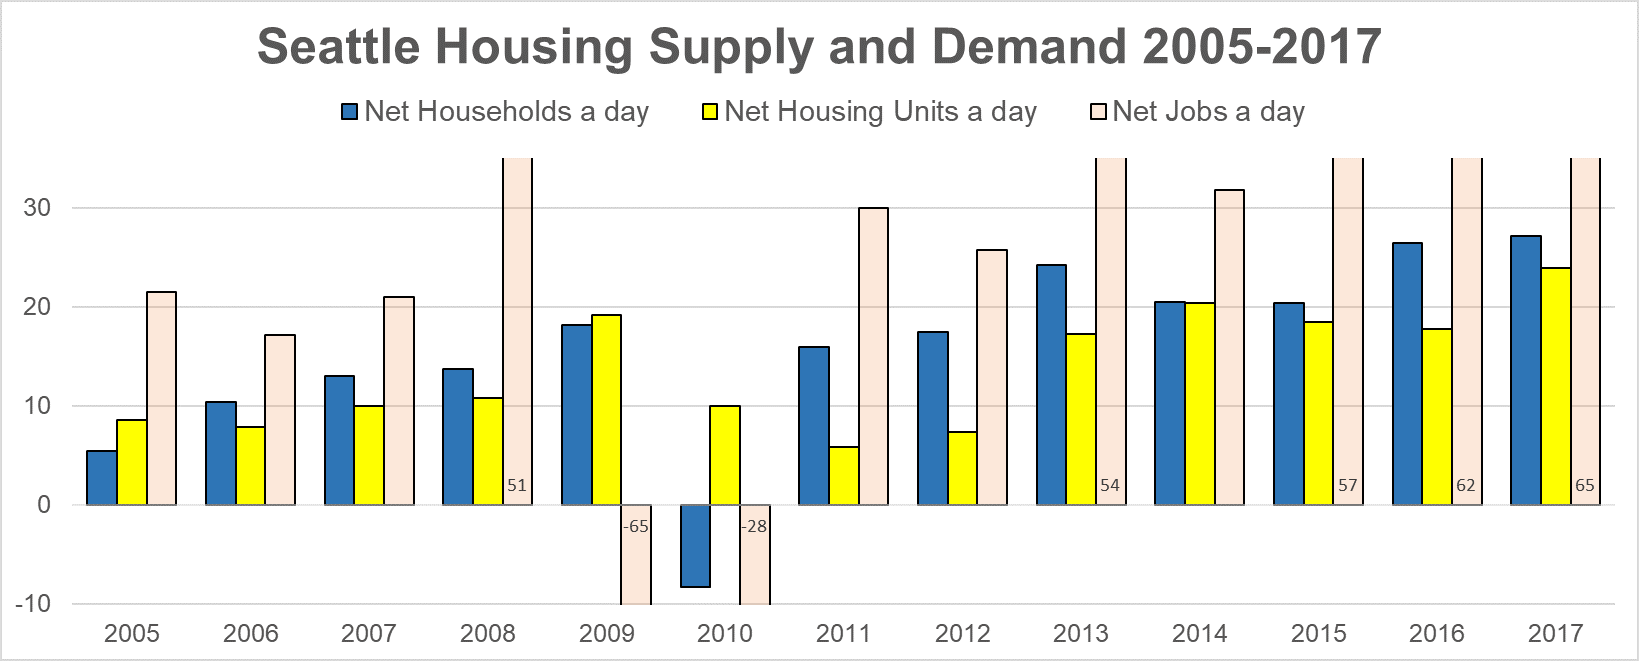
It’s important to keep in mind that supply and demand are not independent forces. Supply responds to demand (technically, to price, which itself responds to demand). You can see this interaction in the chart below with construction latently responding to a population bust in 2010 before responding to the beginning of the population boom in 2011 but, hampered by the global credit crisis, two years later.
Until last week, the latest population figures we had came from a July 2017 Census survey (published near the end of May 2018) while the construction figures come from the Seattle permitting office’s annual tabulation for all of 2017 available only a few months ago. Since May reporters have been using nearly year-old population figures and six-month-old construction figures to explain rents today. If rents primarily respond to demand–or supply lags behind demand even in the most streamlined development environment–then we’re looking at mismatched supply and demand data. And, crucially, we’re explaining changes in rent with only (the weaker) half of these two forces. With last week’s population estimate we can finally look at the demand data contemporaneously with rent data and start to fill in the other half.
Washington State’s Office of Financial Management (OFM) publishes population estimates for April first of each year at the end of June, a much faster turn-around than the Census’ annual population updates. The April population estimate, by allowing us to compare the Seattle population of April 2017 to April 2018, gives us a view, for the first time, of the demand driving Seattle rents for the first part of this year.
For the last seven OFM surveys, Seattle’s population growth rate has, itself, grown. That changed last week.
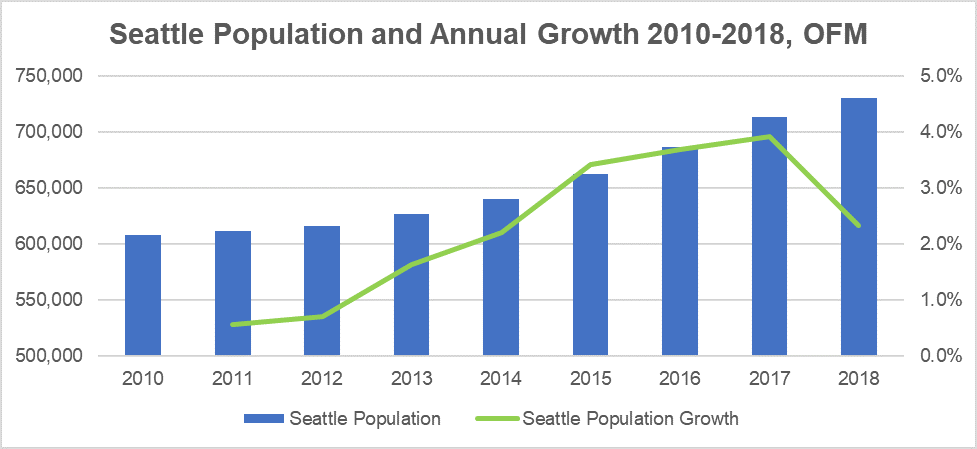
Source: Office of Financial Management
From April 2017 to April 2018, according to the OFM, Seattle’s population boom reversed course and fell to 2.3% annual growth, a 40% drop in growth rate from the prior survey. It’s this difference from the previous survey–translating to about 11,000 fewer people–that best explains the flattening rents in Seattle.
Did the 10,000-plus housing units built in 2017 help temper rent increases in 2018? Of course, but this building boom was itself responding to a population (and income) boom. Now that the latest OFM population estimate shows a tempering in demand, we should not long expect the building boom to continue. If we want to seriously confront housing affordability in Seattle, we can’t primarily rely on market-rate supply to dig us out of the hole we’re in. Policies like a progressive income tax can rein in demand at the high-end while policies that extract value from land like inclusionary zoning can fund below-market-rate housing construction when the market-rate boom goes bust.
An Affordable Housing Platform for Seattle