
In the summer of last year we discovered that Seattle’s population growth rate had fallen for the first time since 2010, according to state demographers at the Office of Financial Management. In 2017, the growth rate was 3.9%. The same time the next year it was 2.3%.
We didn’t know why the growth rate had fallen but the effects were already apparent: rent surveys from the beginning of 2018 began to show flattening rents.
At the time, media outlets and local experts typically pinned the cause of flattening rents on new supply — the building boom — but ignored (or used out-of-date) population changes that may have explained the flattening rents.
Amazon and Housing Demand
The demand side of the housing price equation is too often ignored, perhaps for a lack of good data. The state’s 2018 population estimate for Seattle, however, gave us the first piece of good demand data contemporaneous with flattening rents.
Housing demand isn’t just about population, though. It’s fundamentally population times average wages–how many people are there? and how much money do they have to spend on housing? When the latest population estimate arrived in the summer of 2018, wages and employment figures for a comparable time and space were not yet available.
The Quarterly Census of Employment and Wages (QCEW), produced by the Bureau of Labor Statistics and the state, is released on a seven-month delay in quarter-year chunks. The second quarter survey of 2018 was released last month and it gives us the first look at a crucial housing demand component when Seattle rents started to flatten out.
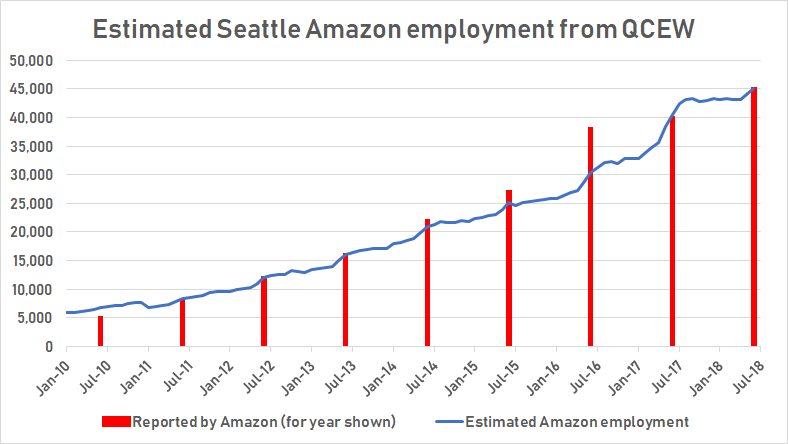
That Amazon, Seattle’s largest employer, drives a lot of the recent job and rent growth throughout the city is not seriously contested (although Seattle’s downtown business association has tried). We know there were about 40,000 more Seattle Amazon jobs in June 2018 than in January 2010 both from statements made by Amazon representatives and, now, with the QCEW.
Countywide, there were almost seven times that many more jobs over the same period. If you believe the seven times multiplier effect attributed to tech jobs in a 2015 tech industry-funded study, Amazon is responsible for the vast majority of job growth in the county. The study probably overestimates1 this effect, but it is hard to overstate the impact of the most valuable corporation in the world on the local economy. Also contributing to the county’s growth is the $180,000 average annual wage2 in the industry sector Amazon dominates, according to the last three annual QCEW reports.
Despite the importance of Amazon to Seattle’s economy, the only employment figures we had for their Seattle offices were those reported by Amazon itself. And it wasn’t until this February that it was possible to get detailed numbers on Amazon jobs into the summer of 2018.2 By then the rental housing market had unambiguously flattened and the for-sale housing market started showing signs of a bust.
Amazon Questions Its Growth in Seattle When Expedient but not When True
Just before the Seattle City Council passed the head tax to fund affordable housing and social services in May 2018, Amazon announced it was pausing work on a downtown office tower. Amazon was to be the largest contributor to this tax. On the day the tax passed council in a 9-0 vote, Amazon Vice President Drew Herdener stated, “While we have resumed construction planning for [the office tower], we remain very apprehensive about the future created by the council’s hostile approach and rhetoric toward larger businesses, which forces us to question our growth here.”
A month later, the city council would again vote on the head tax, this time overturning it in a 7-2 vote.
Amazon had previously played a light touch with city politics (one notable exception is the $350,000 contribution to mayoral candidate Jenny Durkan’s campaign SuperPAC). The announcement of “HQ2,” first made in September 2017, more than six months before the head tax passed the city council, initially worried local business leaders. Within a month, though, Amazon signaled that growth would continue in Seattle by announcing it will lease the to-be-completed Rainier Square downtown office tower. (We will return to this office tower twice more.)
But according to QCEW reports conducted jointly by the Bureau of Labor Statistics and the Washington State Employment Security Department, September 2017 was the endpoint of almost continuous job growth since 2010 for the industry sector Amazon dominates: non-store retailer. In fact, employment in the non-store retailer sector2 for King County does not substantially change from August 2017 to May 2018, when employment ticks up again (although April to June include preliminary numbers that won’t be finalized for another month).
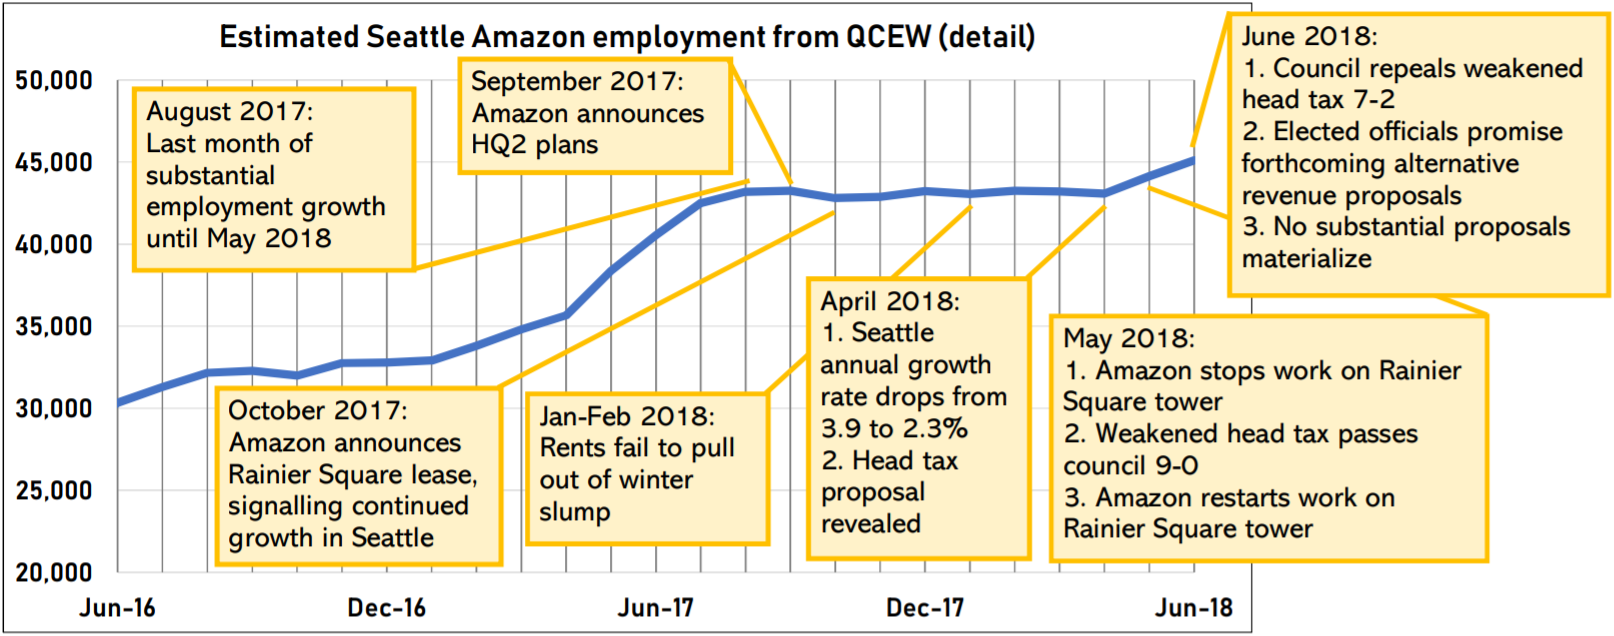
Amazon’s Seattle employment plateau, beginning in late summer 2017, can fill in some major gaps in recent Seattle history:
- When Amazon announced its HQ2 plans in September 2017, its Seattle employment, the main driver of Seattle rent growth in recent years, had just plateaued.
- Next, in the first few months of 2018, rents flattened, barely pulling out of a winter slump, unlike in years past.
- In April 2018, city council proposes head tax to fund affordable housing and services. Amazon would pay the largest share of this tax.
- In early May 2018, Amazon stopped work on the Block 18 office tower and threatens to sublease the Rainier Square tower each intended for thousands of corporate employees in an unambiguous signal to city leaders: tax us and we stop hiring. The number of local corporate employees had hardly budged in nine months.
- Throughout the first half of 2018 media outlets and industry experts announced that flattened rents were due to a surge in residential construction despite continued growth or, sometimes more specifically (and ultimately sourced to statements from Amazon press agents) continued Amazon employment growth.
- Then, in early summer of 2018, the state demographer published population estimates for the city of Seattle as of April 2018. The results showed a decline in population growth rate for the first time since 2010. It went from 3.9% in 2017 to 2.3% in 2018. The growth rate slow down didn’t receive the same fanfare as boom reporting does (KUOW and The Urbanist excepted).
- By late summer, regional multiple listing service statistics showed a pattern of rising listing times and falling median sale prices for houses. A modest spike in interest rates, declining investment from Asia, buyer fatigue, and the aforementioned supply surge were common explanations.
Finally, just two weeks ago, that downtown office tower that reassured local business leaders after the HQ2 announcement — and then panicked politicians in 2018 during the head tax debate — was back in the news. Amazon is abandoning plans to use Rainier Square office building all to itself. The building will have space for 3,500 to 5,000 office workers, estimates The Seattle Times. A press agent responding to GeekWire, which broke the story, said, “We are currently building two million square feet of office space in our South Lake Union campus in Seattle. We are always evaluating our space requirements and intend to sublease Rainer [sic] Square based on current plans. We have more than 9,000 open roles in Seattle and will continue to evaluate future growth.”
Of course, this could all just be an unusually long interruption in Amazon’s corporate payroll numbers, a rebalancing after a period of aggressive expansion. The last two months of the 2018’s second quarter QCEW survey show Amazon employment growth back in line with the long period of growth that ended in August 2017. We will know more when revisions are made to the latest survey and a fresh crop of surveys arrive in a couple months.
I asked Amazon about the nine month employment plateau from 2017 to 2018. They did not specifically deny the claim:
“We don’t provide monthly updates on employees, but we did announce 45,000 in Seattle in March 2018 and we’re continuing to grow–we have over 10,000 roles open in Seattle right now.”
Whatever the recent ambiguous statements about Amazon in Seattle portend, the parallel turns in Seattle rents, housing prices, and Amazon employment demand greater scrutiny. In Seattle, housing supply is largely a product of housing demand and if that supply responds, as it has in years past, to falling housing demand we should soon expect a downturn in the building boom.
Even if Amazon caps wages and doesn’t expand employment we will still have a housing affordability crisis. For this reason the production of non-profit or social housing through new revenue sources like land value capture and demand controls like a progressive income tax3 are essential to finally getting out of this crisis.
Endnotes
- And it’s worth being skeptical: the study reports that “Nursing and Residential Care Facilities” received the fifth largest employment multiplier effect from state tech growth. The industry that got the biggest boost from tech growth? “Other Retailer,” a classification that includes the “electronic shopping” industry which, in Washington State, is primarily composed of Amazon corporate workers.
- The average annual wage for 2016 is for “Nonstore retailers” in King County which includes electronic shopping companies, vending machine operators, door-to-door sales, and the like. Electronic shopping, however, clearly dominates this industry group and Amazon dominates the electronic shopping industry which is reflected in the average wages. In 2017 and 2018 furniture stores and gasoline stations were rolled up with nonstore retailers as “Other industries.” This is a suppression technique to make identifying individual businesses more difficult. The steady employment numbers of these other industries at the state level, where they are unsuppressed, however, make it possible to get an estimate of Amazon’s employment in King County in the nonstore retailer sector. The largest room for error is the initial estimate of Amazon employment in January 2010. For that I relied on statements from Amazon, QCEW employment figures at the county and state level, and back-casting from suppression events.
- A progressive income tax is both a demand control and a new revenue source!