Snohomish County is weighing a 15-square mile expansion of its urban growth boundary in an area called the Clearview Cluster. Even now, suburban sprawl is already leaking in, which invites the question: Is the Growth Management Act working as intended?
Exiting northbound SR-522 in Maltby, you drop from the highway and into a quick chicane of lefts and rights. You exit to a local road before crossing the railroad tracks and heading up the hill. Within sight of the intersection is a converted farmstead, home of the Snoqualmie Ice Cream company. Bright red, sitting like a beacon. You pull up and realize they closed their scoop shop for the season back on Labor Day. That makes a lot of sense this particular Thursday, when everything was covered with snow.
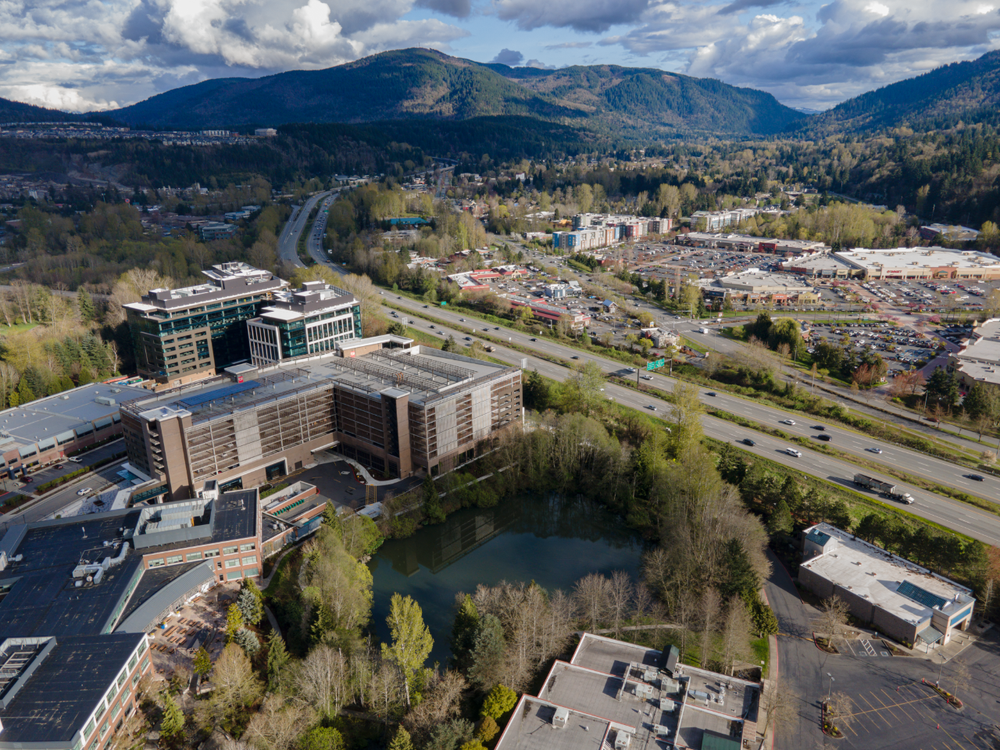
Maltby is at one edge of 10,000 acres of “rural homes and hobby farms” that Snohomish County evaluated for inclusion in the Urban Growth Area (UGA). What’s being discussed is whether the boundary of urban development–the service area for utilities, transit, and public services–will close around a region of large lot residential properties at the eastern edge of Bothell.
The inclusion or exclusion of this area is not important in itself. The area is already part of the suburbs, whether or not that is recognized. The larger question is, moving into its fourth decade, what does Washington’s Growth Management Act (GMA) actually mean? The erratic boundary around Maltby and glut of sprawl around Bothell shows just how fragile the GMA has become.
The Wiggly Edge of Urban Growth
For two years, Snohomish County has been examining the area of Maltby, Cathcart, and Clearview as the Southwest Urban Growth Area Boundary Planning Study. We need to unpack this title a little bit because it’s only the southeast corner of the Southwest Area that’s under consideration.
The Southwest Urban Growth Area (SWUGA) is what most Seattleites think of as developed Snohomish County (map here). It is everything from King County’s north boundary to the Snohomish River, and includes Everett, Edmonds, Lynwood, and Bothell. There are other Urban Growth Areas in the county, like Marysville, Arlington, and Gold Bar. The study focused on one specific part of the Southwest UGA.
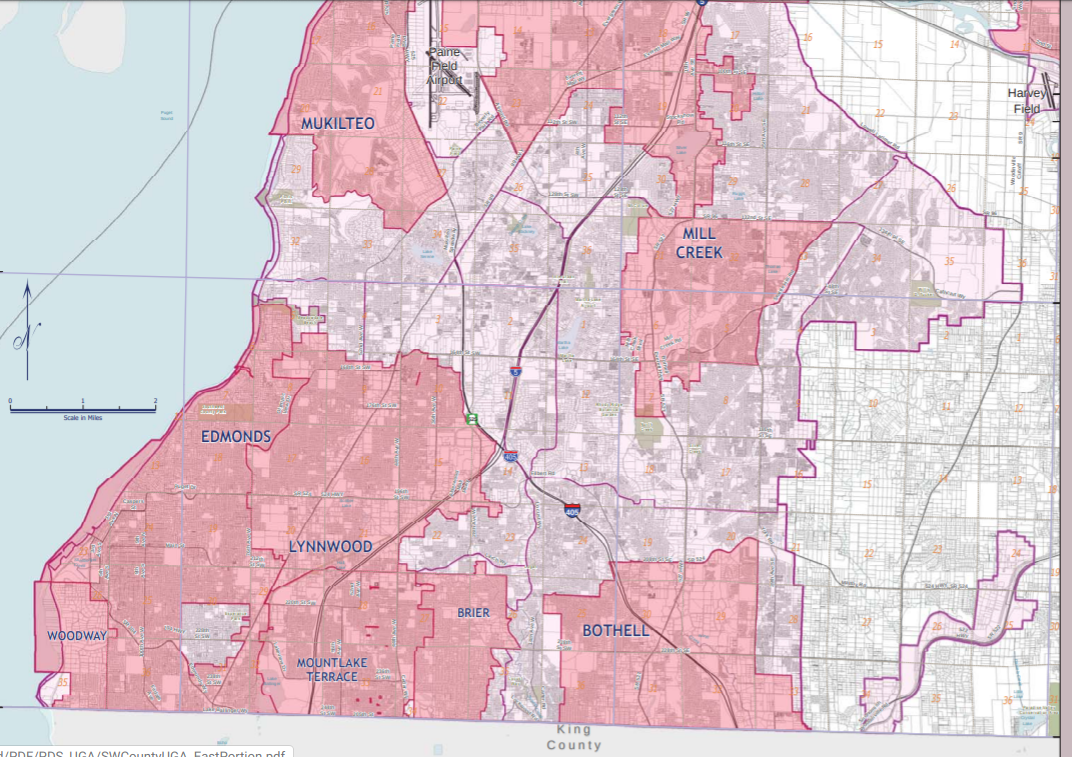
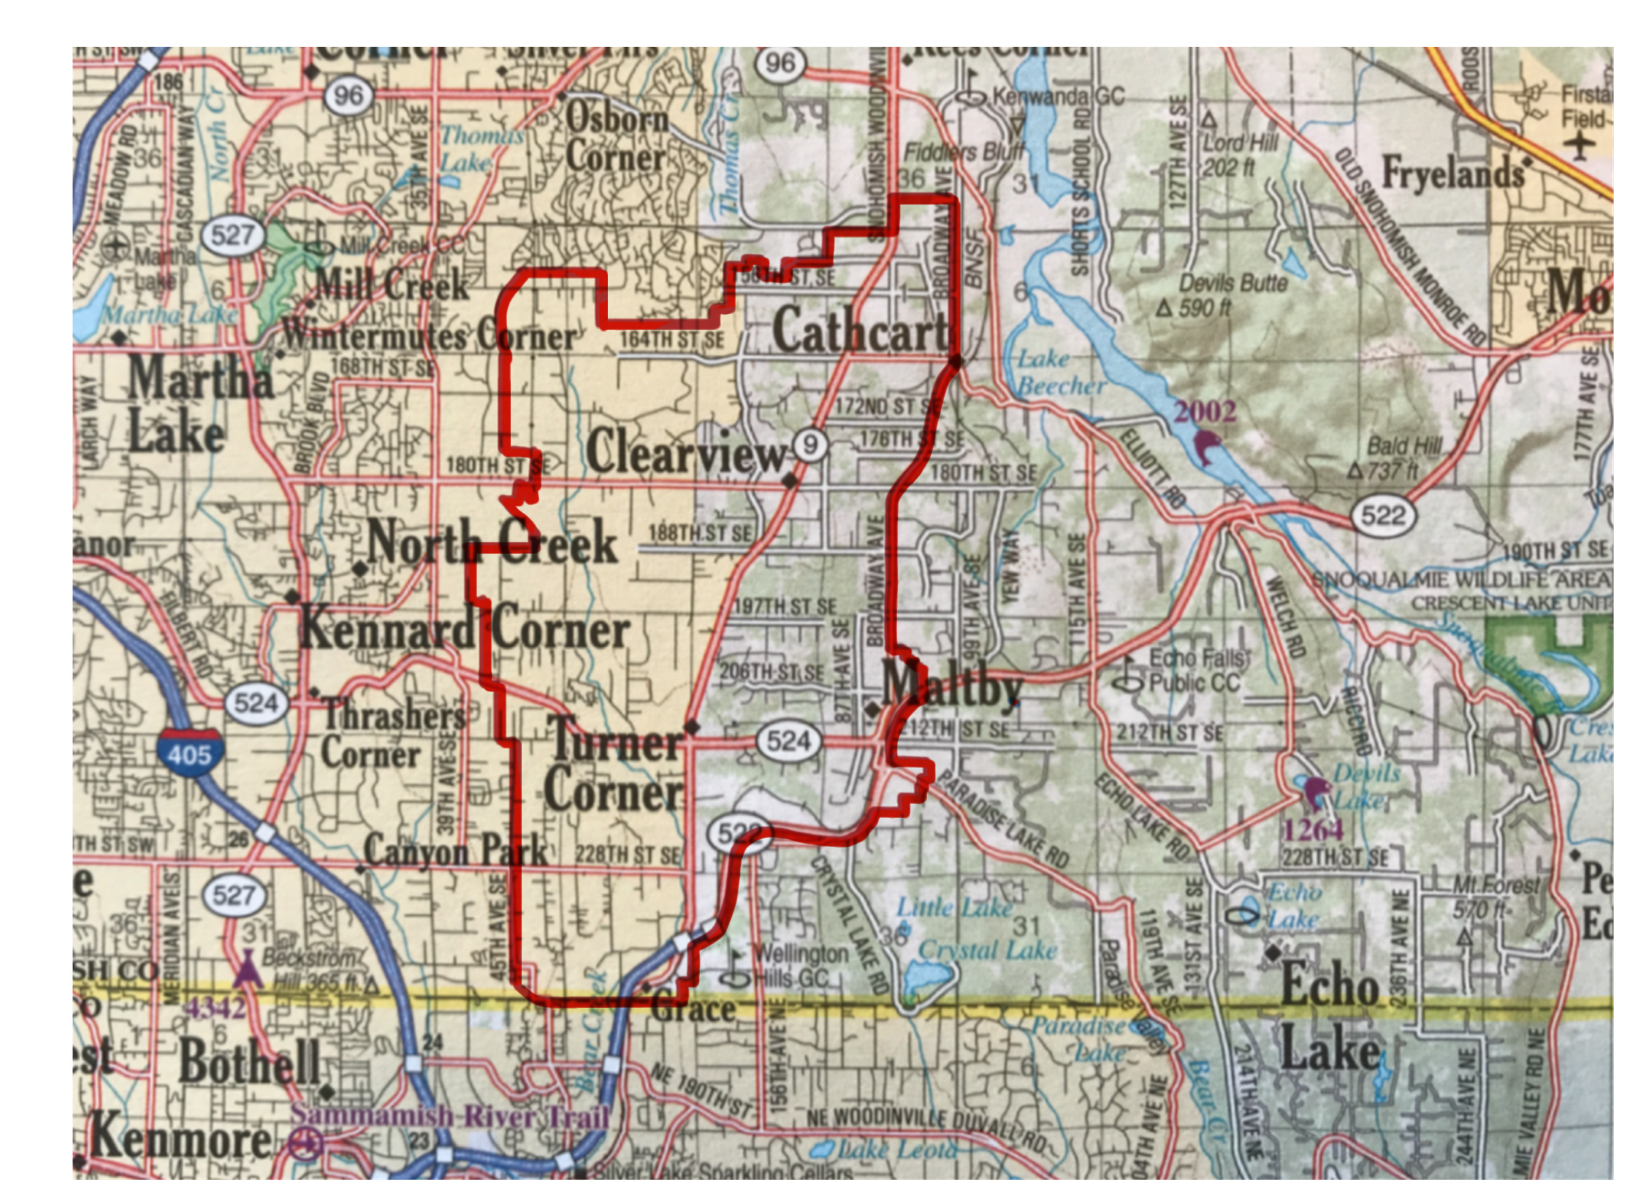
The western edge of the SWUGA is easily comprehensible. It’s Puget Sound. The eastern edge of the SWUGA is more complex. Around Everett, the boundary follows the Snohomish River. Outside Everett, the boundary follows the ridgeline of the river and Lowell Larimer Road.
Then, south of Cathcart, the boundary makes an abrupt western turn. For three miles, the boundary is an erratic heartbeat, before turning south for more back and forth pickups and exclusions. When the boundary meets the King County line, it falls right in the center of rapidly growing Woodinville.
Additionally, just east of where the growth boundary meets the Snohomish/King County line, there is another inclusion. On both sides of SR-522, the boundary is wrapped to include the industrial and commercial properties on either side of the highway.
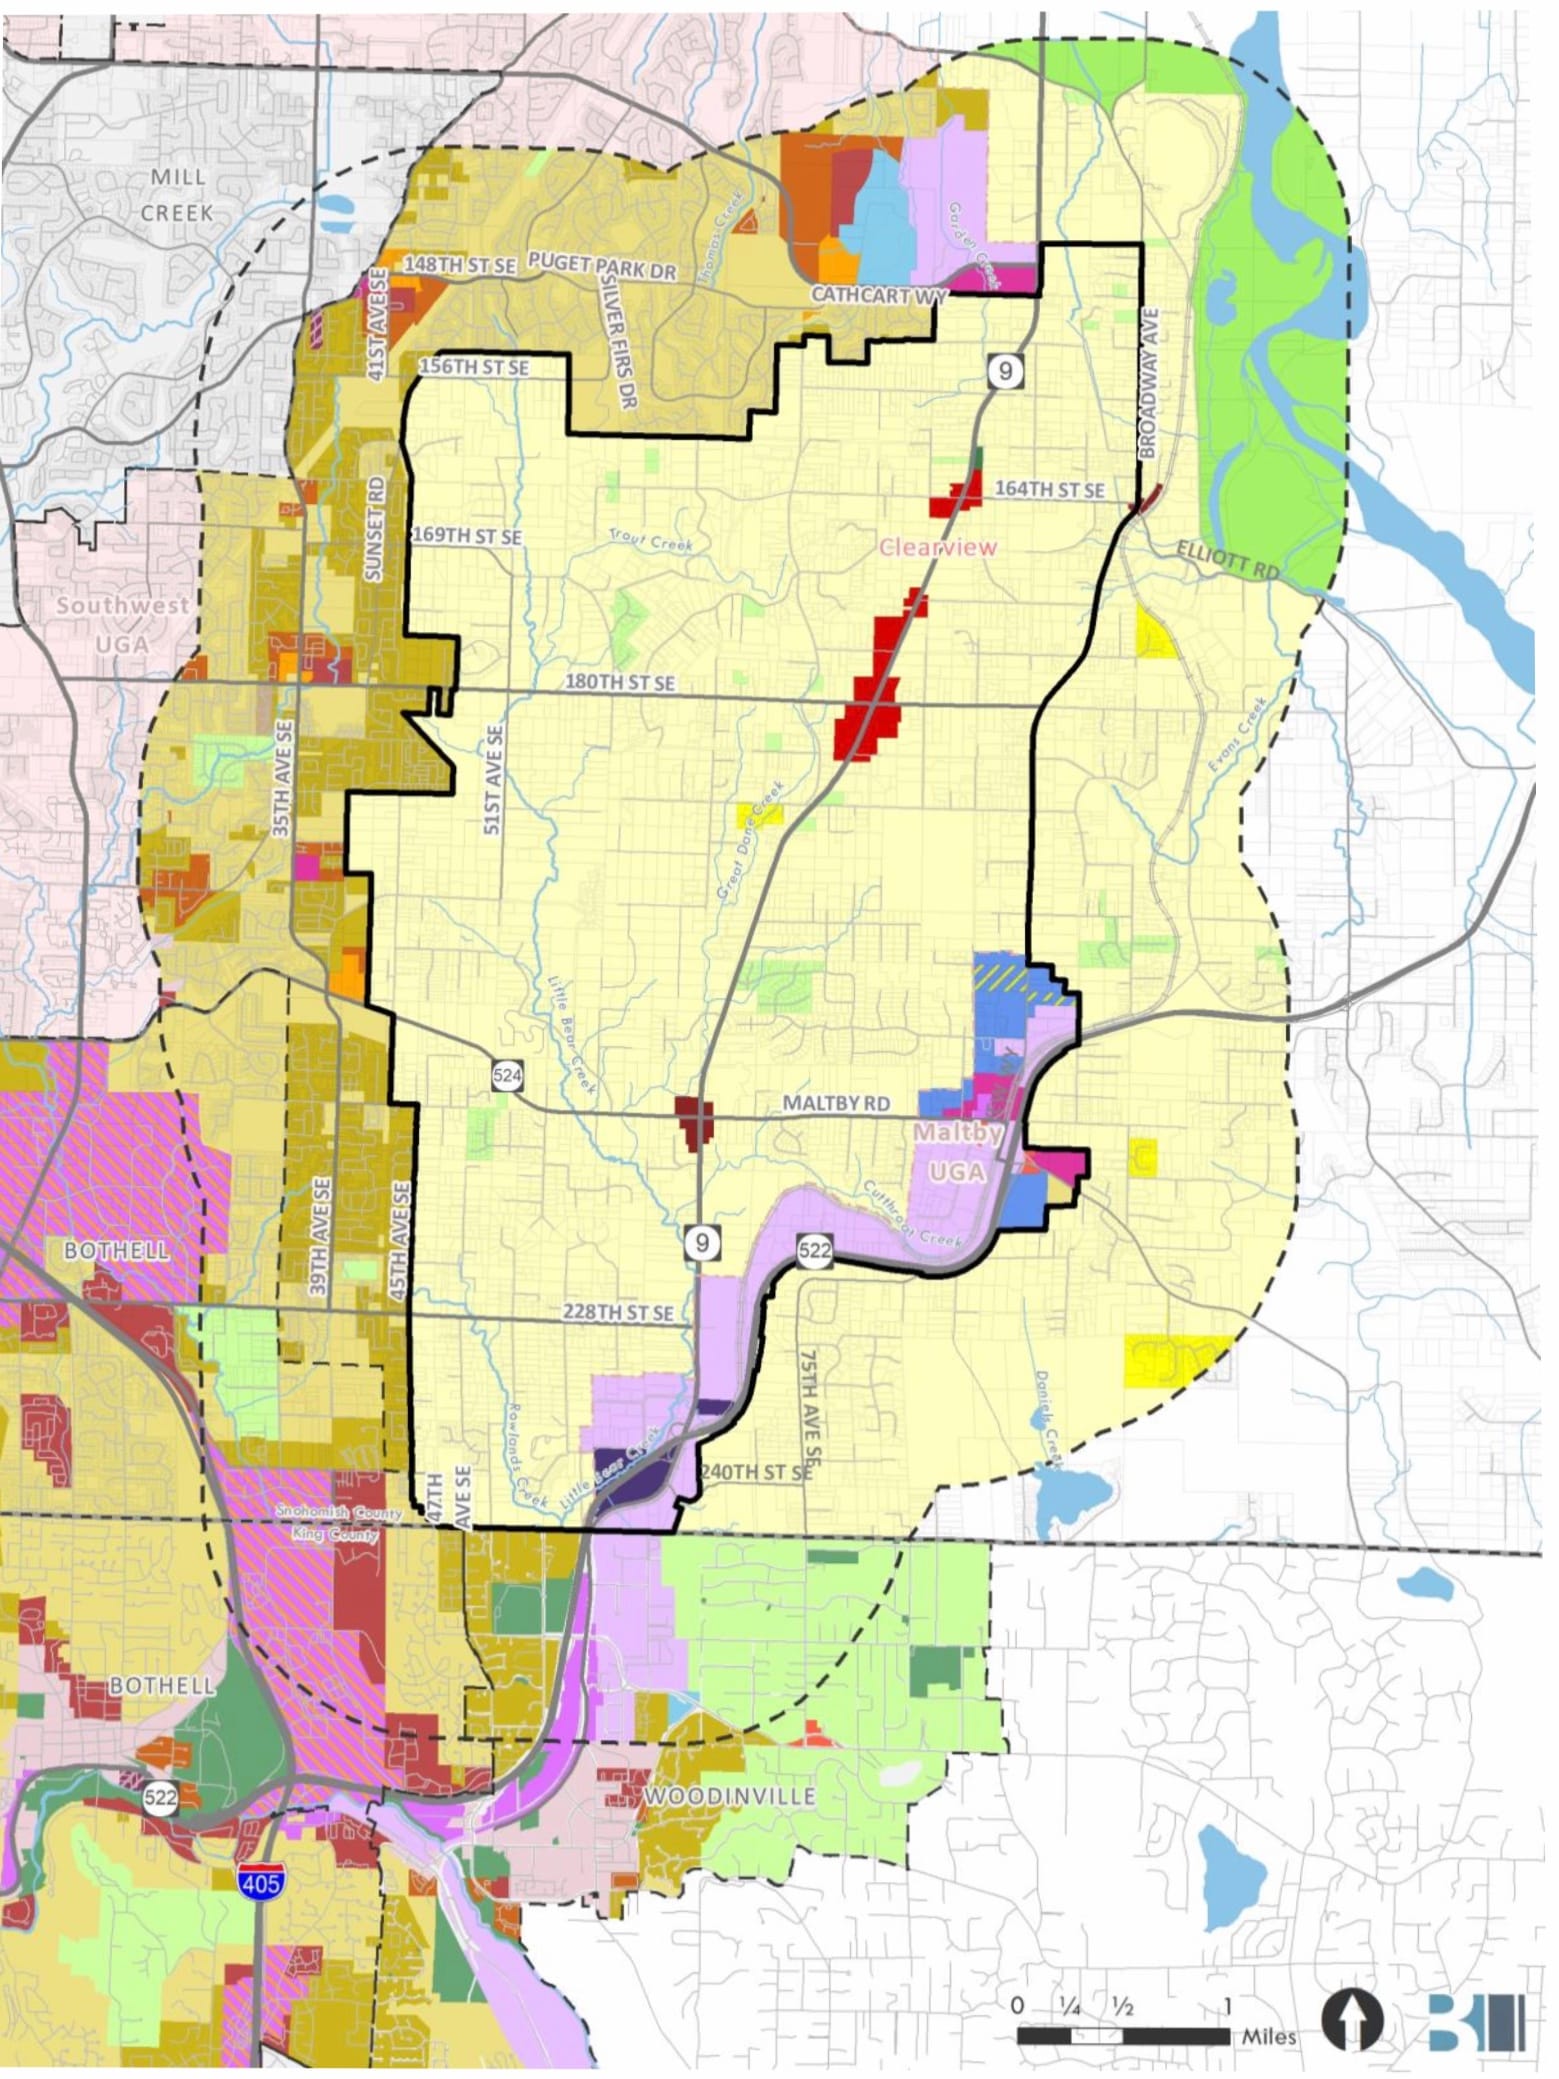
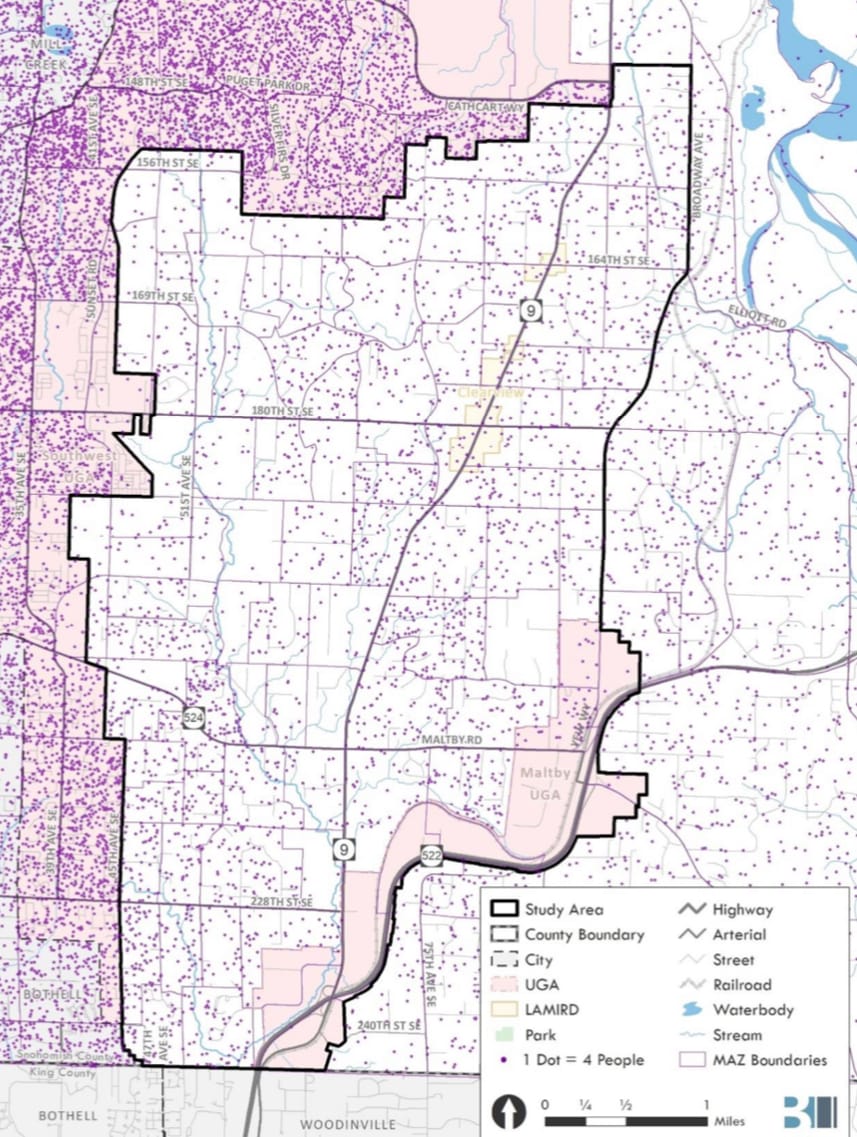
The SWUGA Boundary Planning Study area is formed by drawing a line from Cathcart to Maltby, and eradicating the erratic lines and westward digressions in the growth boundary. The area is about 15 square miles. The study calls this space the SWUGA BPS area. How about we call it the Clearview Cluster to avoid confusion with other abbreviations and to make sure we realize this is a tangible place rather than an abstraction.
The Clearview Cluster Study
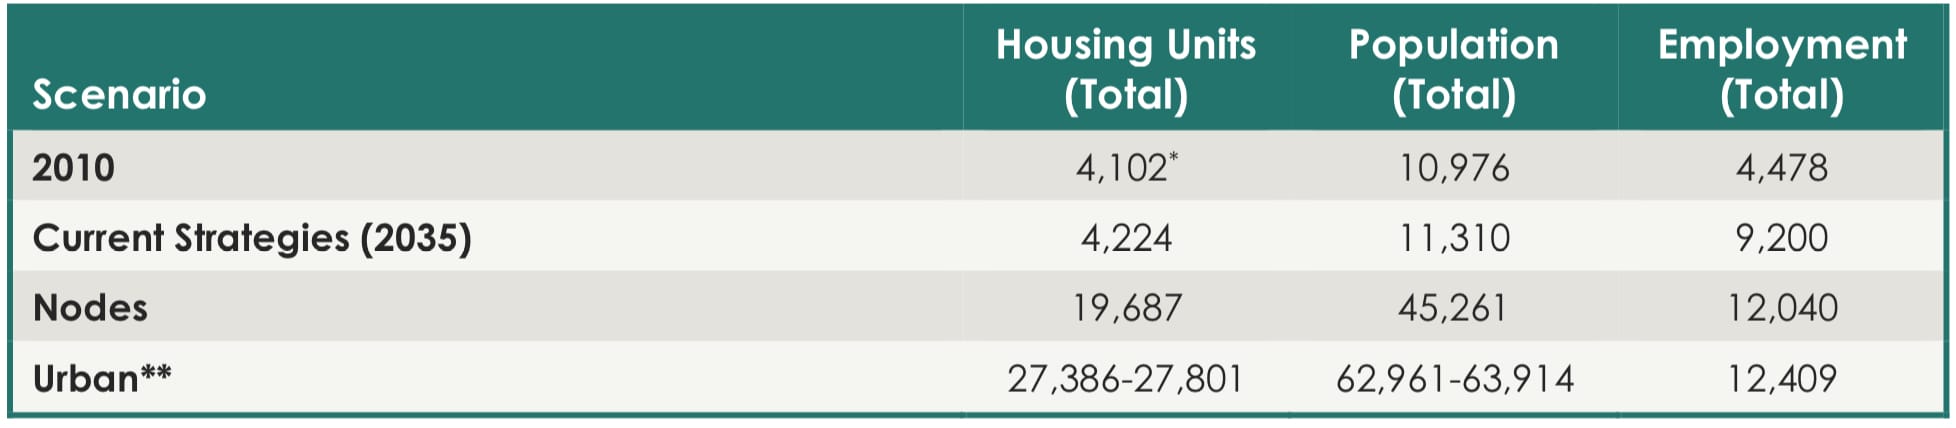
To not bury the lede, the study does not come to a conclusion on whether the Clearview Cluster should be included in the Urban Growth Area (UGA). The authors used outreach, environmental impacts, and service delivery to test three scenarios for development–“Current Strategies”, “Nodes”, and “Urban”–with the latter two requiring a change to the UGA. These scenarios are now handed off to county officials to make the political decision about the future of the UGA boundary.
To develop these scenarios, the study consultants created a Development Index for both residential development potential and commercial development potential. These heat maps show acceptable spots for development considering vulnerability of the landscape and the appropriateness of uses in a particular locations throughout the Clearview Cluster.
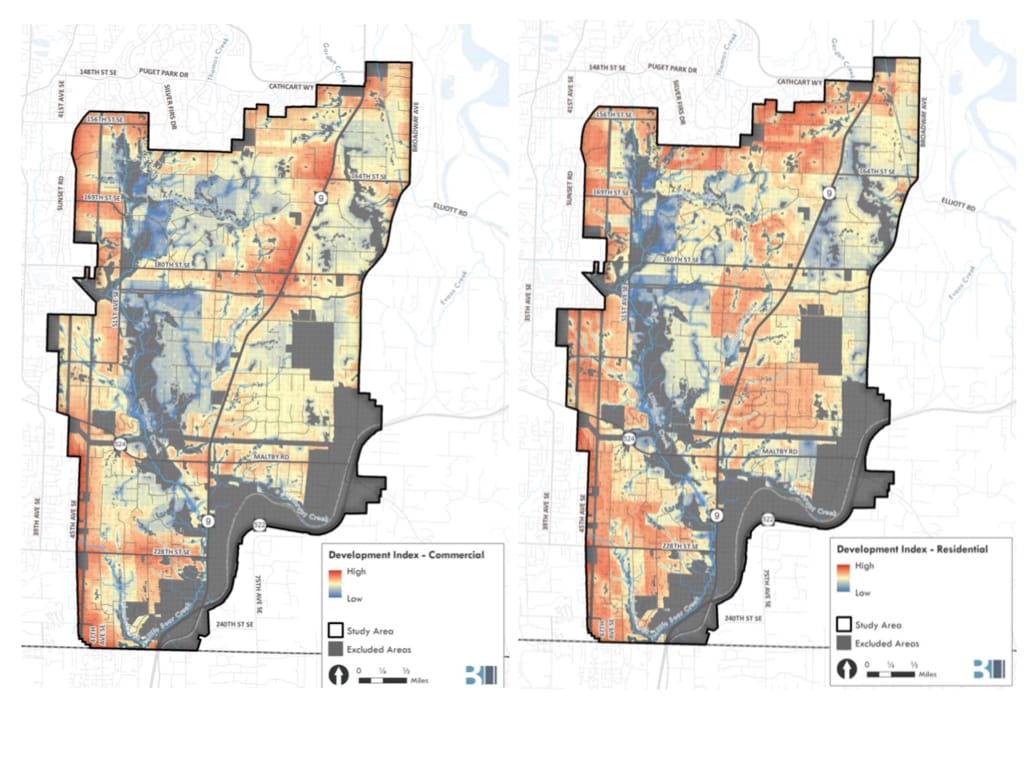
Based on this analysis, the most suitable places for both residential and commercial development were along the existing edges of the UGA and along the main arterial of SR-9. The scenarios concentrate development in these places, with the Current Strategies scenario keeping the same population of 11,000 people in the area, the Nodes scenario adding 40,000 people, and the Urban scenario adding 60,000 people.
The study then takes these projections and runs them through a series of tests to see the how much the two growth scenarios will diverge from the Current Strategies scenario. There will be an increased need for transportation, roads, and utilities. Parks will need to be built, public services provided, and trails extended. There are costs to these extensions.
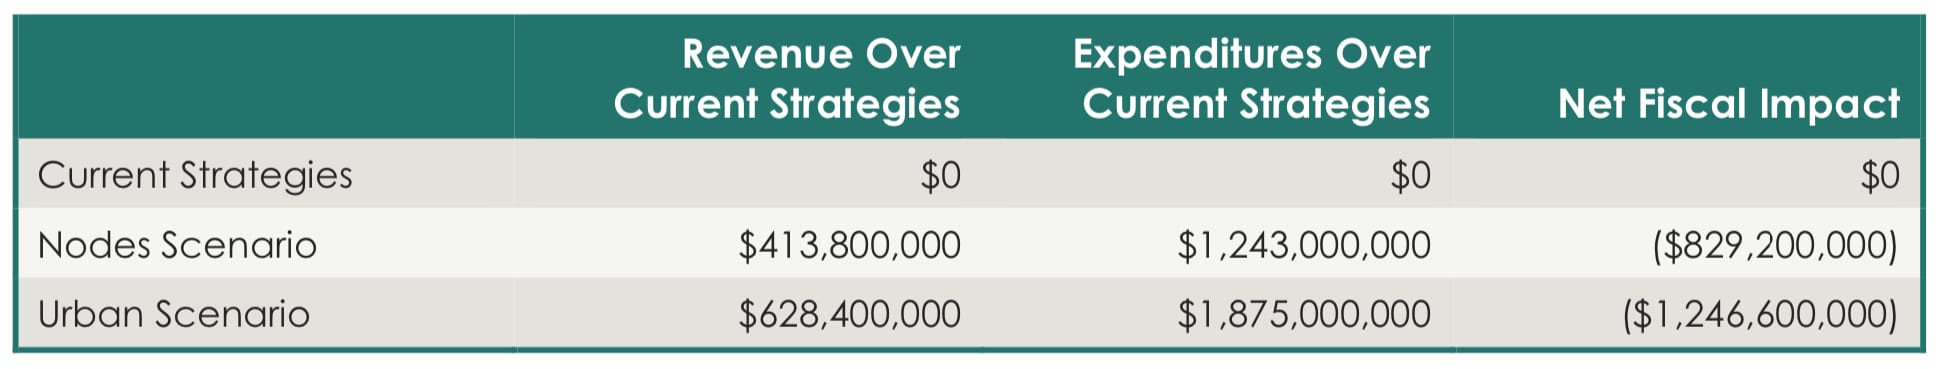
The end result is a fiscal impact statement, a calculation of the costs of developing the area versus increased county revenues. Both of the growth scenarios see the cost of developing the area exceed the potential income.
While that fairly upside-down impact would suggest a hearty rejection of expanding the growth area boundary, there are competing concerns. Mainly that “population growth on unincorporated lands in this part of the SWUGA exceeded long-term targets for growth, and remaining land available for growth is in limited supply.” (1.B-2) Snohomish County is running out of developable land. More accurately, they’re running out of a particular type of developable land.
The Wiggly Expectations of Urban Growth
Developable land in Washington is set by the Growth Management Act (GMA). Passed in 1990, the GMA requires the adoption of multi-county planning policies to guide growth within an urban growth area. These policies provide for coordination and consistency among the metropolitan counties to address related regional issues and ensure consistent binding effect of regional policies. This regional framework is guided by the Puget Sound Regional Council (PSRC) that is currently updating its Vision 2040 to Vision 2050. County and municipal land use decisions, including the establishment of each county’s urban growth area, must be consistent with this regional framework.
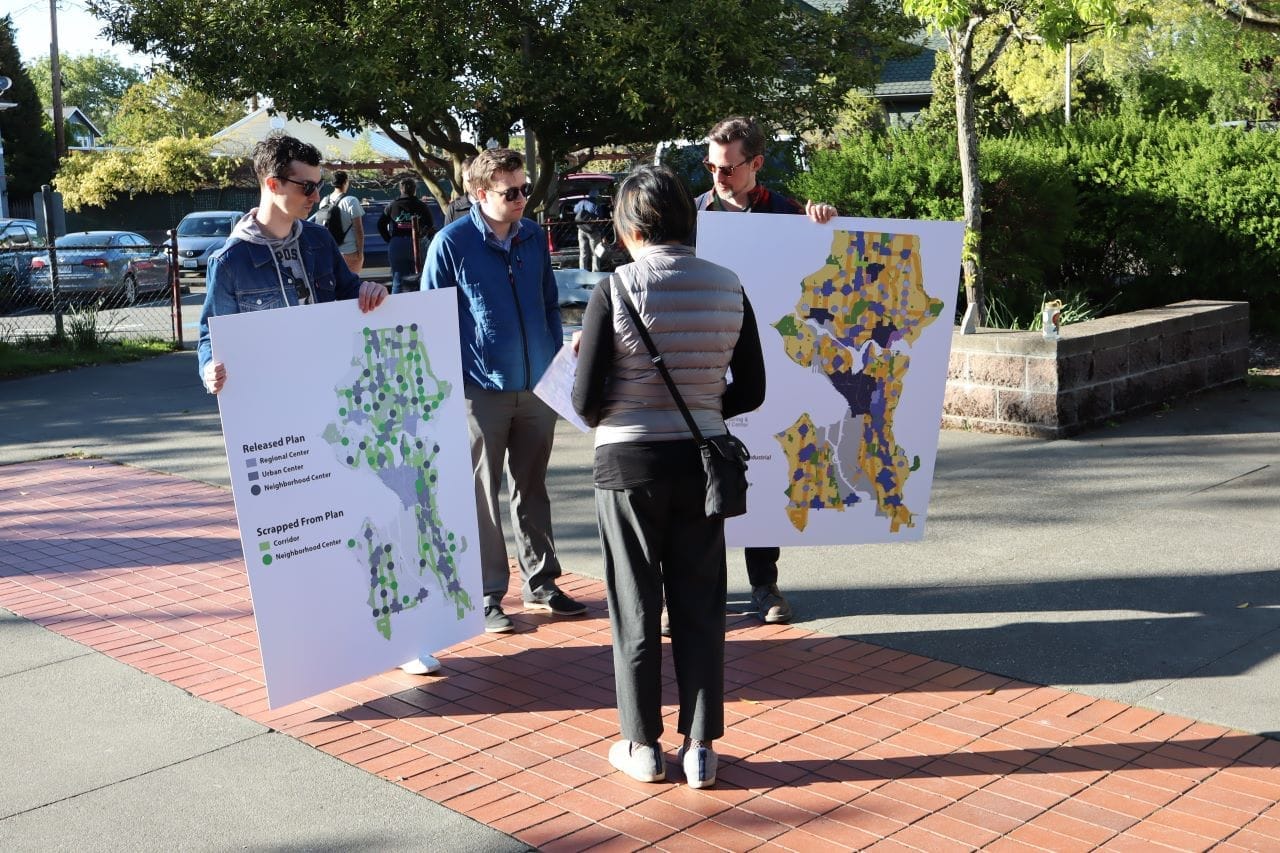
Vision 2050 is an evolution of its predecessor, considering several new concepts like housing displacement and climate change. The core of all the PSRC Vision documents is the emphasis on development in centers throughout the region. Mixed-use centers and manufacturing/industrial centers are different sizes and scales, spread throughout the region’s cities. The cities are just one of eight different regional geographies. Growth targets in these centers are broad, and consistency is just as varied as the centers themselves.
Pressure to reform the GMA has come from both outside and inside the boundary. Rural communities see the increasing population falling towards the largest cities in the region, without adequate services, growth allotment, or consideration given to rural places. Urban communities are constrained by regional vetos on transit projects and suburban hierarchies of development. All of this is propelled by our regressive property tax system, where community budgets rely on development and increasing property values. Regionalism around the Puget Sound among four counties, half a dozen tribes, a dozen planning and transportation authorities, a hundred municipalities, and another hundred special service districts is less governance and more Thunderdome.
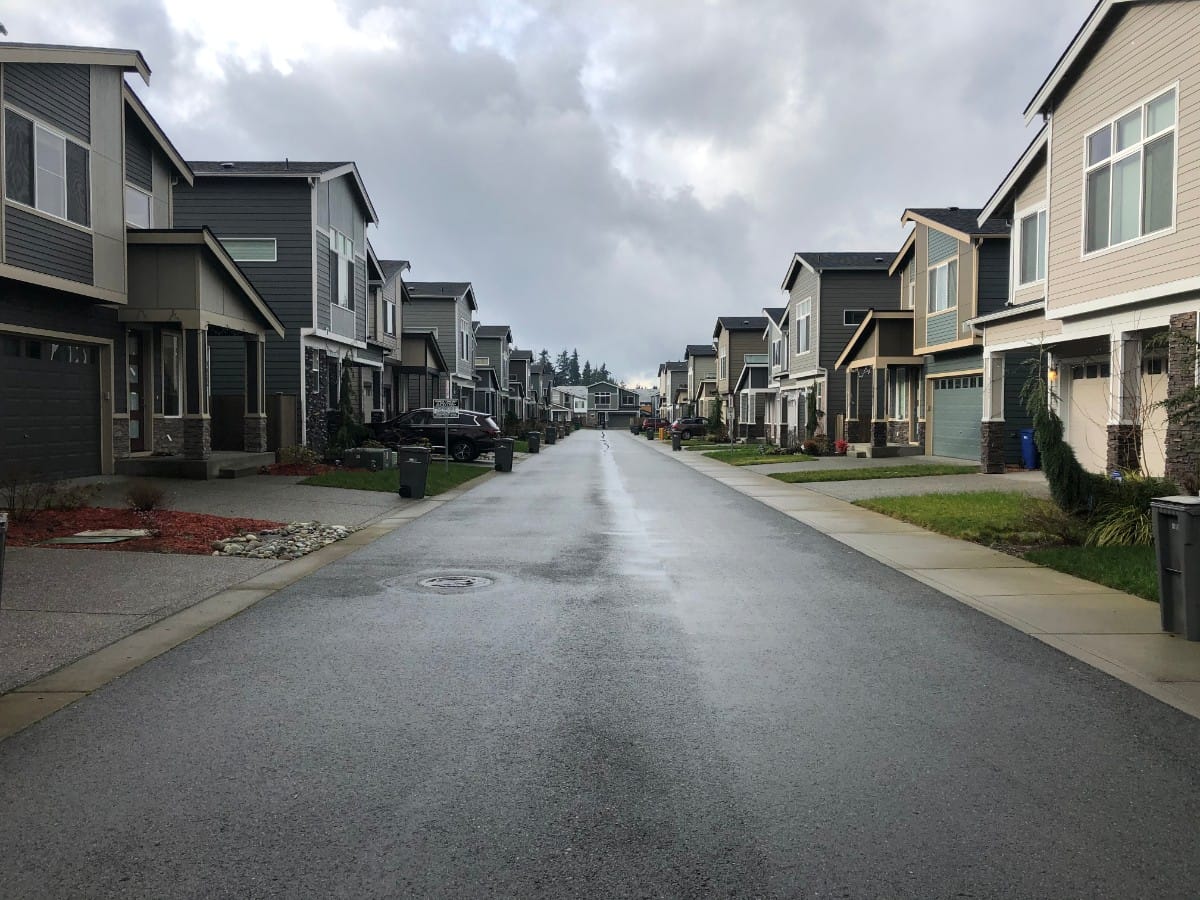
This competition has written itself into the Urban Growth Area. There are five different geographies bounding the Clearview Cluster. To the south is Woodinville, a municipality with zoning authority in a completely different county. Their growth area goes further east than the boundary study proposes. To the west, the Cluster abuts the municipality of Bothell as well as the unincorporated Urban Growth Area of Bothell. It is not Bothell proper that has seen significant growth, it is the unincorporated land between Bothell and the UGA that has exploded with houses. Northwest of the Cluster is Unincorporated Mill Creek. North is Unincorporated Everett. Although Maltby is an identifiable community, it is not its own municipality. The UGA surrounding it is unincorporated, but not seeing the type of development that has arrived near Bothell.
So, the Urban Growth Area is as varied as its boundary. This mixture of density within the GMA creates incredibly perverse conflicts. Outlying communities like Snoqualmie and Carnation have grown faster than close-in communities like Shoreline and Clyde Hill. Designated Manufacturing and Industrial Centers have lost employment. And according to a Sightline analysis, there are neighborhoods within Seattle proper as well as the urbanized region that have lost population during the building boom of the last decade.
This was recognized by the former State Senator Guy Palumbo for District 1 (Maltby and Bothell). While he was sponsoring a Minimum Housing Density bill to compel municipalities to upzone around transit, Palumbo said, “At a high level, if Seattle was taking enough growth, we’d have downward pressure on prices,” and that would reduce the pressure to develop in areas like unincorporated Bothell.
That applies to many areas within the Urban Growth Boundary. It is just one type of land within this boundary–unincorporated land–that’s running low in Snohomish County. The report, circuitously, emphasizes how poorly such development pays for itself.
A Study of Predetermination
The SWUGA study’s fiscal evaluation posits that Nodes or Urban development will cost the county between $800 million and $1.2 billion in expenditures over the Current Strategies scenario. The expansion of services, transportation, and utilities is very expensive. But the study sets the fiscal impacts of the Current Strategies scenario at zero. Does this mean that the Current Strategies scenario pays for itself?
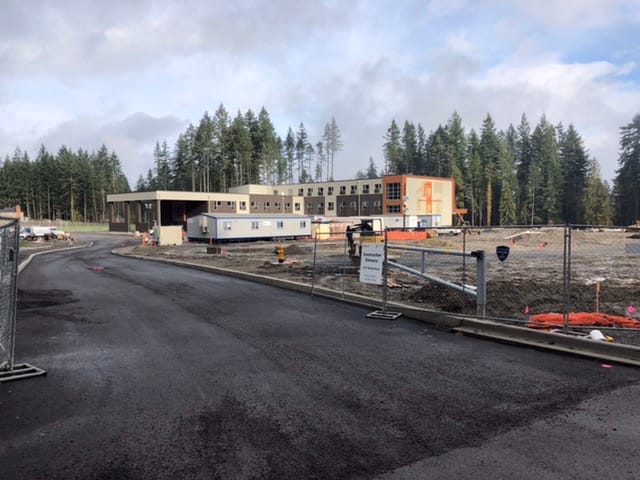
No. The Current Strategies scenario requires up to 87 new arterial lane miles, costing between $600 million and $1.3 billion. (7.B-29) Fire response is not meeting its benchmarks under the Current Strategies scenario (7.D-10) Almost every school currently serving the area is over capacity (7.E-4) and five new schools are planned at a cost of $400 million within or adjacent to the Clearview Cluster. Three stormwater drainage improvements are underway in the area, as is a river restoration project. This is in addition to mitigation for 2,281 acres of impervious surface allowable under Current Strategies scenario. The Current Strategies scenario costs are set at zero as a benchmark to judge the other scenarios. However, just because it’s already budgeted does not mean it’s going to be paid for.
Using the same revenue model as the consultants, the 11,430 people that currently reside in the Clearview Cluster will produce $139 million in revenue for the county over the next 15 years. That is a tenth of the money needed to upgrade just the arterial lane miles, much less the other infrastructure serving the area. The Clearview Cluster and the county are already running at a severe deficit for this style of suburban development.
To take this deficit as the baseline scenario, zeroing it out to cloak the fiscal sink that is suburban development, is a fiction that does a massive disservice to county taxpayers. But it is not the only fiction. The urban growth boundary itself is a convenient fiction.
Already there
Driving into Maltby gives a false sense of ruralness of the Clearview Cluster. There are two other roads (no transit) that can be used to access the area: SR-9 and Cathcart Road. Following either of them shows how development has already surrounded and passed this area.
Driving SR-522 from Bellevue, the exit for SR-9 is just before the exit for Maltby. Located almost exactly at the line between King County and Snohomish County, a right turn from the exit will put you south into the shopping centers of Woodinville. A left turn will send you north into an industrial valley and water treatment plant before heading up into the Clearview Cluster area.
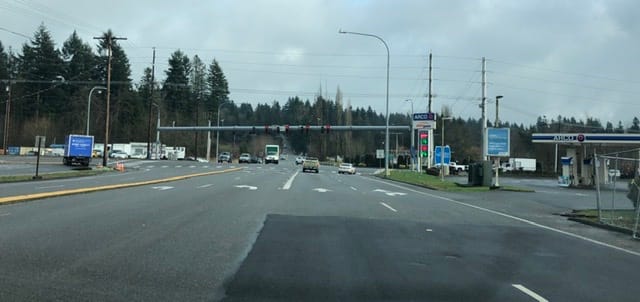
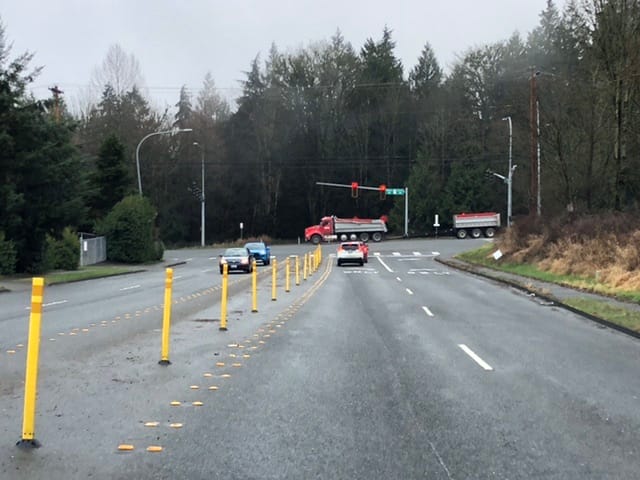
State Route 9 is a four lane arterial. There are wide shoulders and even wider intersections. It rolls with the hills through trees and occasional driveways before hitting intersections with Maltby Road or 180th Street SE. These signalized intersections are marked by gas stations and convenience stores.
This is Clearview, itself is a unique entity. In GMA parlance, it is a LAMIRD or Limited Area of More Intensive Rural Development. It is a center of a sort, yet outside of the growth boundary. Unique in Snohomish County, but more frequent elsewhere in the state, LAMIRDs were developed as isolated clusters of existing development, intensifying tourist uses relying on a rural setting, or clusters of small scale businesses and industries. They’re points of holdover development or new building outside the designated UGA.
The other way to get into the Cluster is from the north. Cathcart Road leaves Interstate 5 as SE 128th Street, a four lane arterial with a center turning lane. For a couple miles east of the highway, the road passes all the accoutrements of suburban sprawl, with grocery anchored shopping centers and stand alone Taco Bells. Just past the Applebee’s, the trees on either side of the road get taller, and large privacy fences appear topped with barbed wire.
Individual driveways become fewer, but the road stays wide. The curb cuts are replaced by large intersections turning into developments. To the south are housing tracts named The Falls and Monte Vista. Just on the other side of these developments is the northern edge of the Clearview Cluster area. To the north, behind a large fence, is the 1,800 student Glacier Peak High School and the 680 student Little Cedars Elementary School. Then there is the Snohomish County Department of Public Works Cathcart Operations Center. These public facilities are part of a 600 acre development of what was once a landfill. The high-speed arterial comes to a three-way terminus at SR-9. This is the northern edge of the Clearview Cluster.
In many ways, it is disingenuous to talk about urban growth overtaking the Clearview Cluster. Highways like SR-9 and Cathcart Road roughed in the development pressure on the area. LAMIRD designation and squiggling growth boundaries picked away at cohesive rural settings. Now it is just a matter of deciding when to turn on full development. Allowing growth to catch up is just the predetermined outcome when we answered the question of how wide to build these roads. Not to mention almost 78% of the study area is already surrounded by the urban growth boundary and regular road maps identify most of the area as urbanized.
Now, the question we should be asking is what happens on the other side of SR-9, or on the other side of SR-522, or just east of Cathcart? When the four lanes of traffic come to a three-way stop, where does it go from there? The population density inside the Clearview Cluster is the same as it is just east of the study boundary. Is this study is just one progression towards the next argument to bump the growth boundary eastward a little more.
At the moment, those homes are conveniently obscured by good tree cover (and more than a little snow). But the next things to the east are real rural. The ridge line into the Snohomish River valley, Paradise Valley Conservation Area, and Lord Hill Park. It is easy to say we will conserve these areas, but just across the river is Monroe, a city with an urban growth boundary of its own. How long till they merge?
A True Edge
When we talk about urban growth, we must also talk about the edge of urban growth. If we put full capacity highways or brand new schools or commercial zoning right up to the very edge of the urban growth area, the immediate pressure will be to expand the urban growth area.
The study recognizes this in its own way. “The ‘edge’ between these rural lands and the long-time urban industrial/commercial area results in its own set of tensions.”(1.B-2) The consultants then review the types of tools available for making this transition. There are growth pattern tools, like designating permanent low density areas, requiring open space at a rate with new development, and using critical areas as separators between development and rural. Some are design tools, like stepping down scale of development, using buffers and landscaping, and separating uses . Then there are the big development tools like transferred development rights and land trusts. There is a lot of discussion of rural “character.”
One tool is not discussed: reducing the size and capacity of infrastructure before it approaches the urban growth boundary. We do not do this, and that is why the irregular boundary of the urban growth area has failed.
An urban growth boundary does not make sense when we draw it to look like a North Carolina election district. The Growth Management Act technically recognizes this, calling for the urban growth area to be set by demonstrated need, possible service with urban infrastructure, and logical boundaries.
In practice, leaving the boundaries to political processes allows them to be illogical. They follow property lines instead of topography and geography. They loop back and forth, with roads half loaded with density. They push arterials up to the edge of development and allow campuses to be outliers on the fringe when they should be surrounded by homes. The GMA has been specifically amended to allow schools to hop the boundary.
These crazed and irrational boundaries are not limited to the edge of the urban growth area. As we see with the tiered dizziness of municipalities and unincorporated areas, they also cut inside the growth area. Municipal boundaries follow streets, with the north side and south side maintained by different cities. Industrial centers stretch across waterways, but not across alleyways. Zoning boundaries follow hundred year old redlining edges rather than any modern need for housing. Density increases show up in unincorporated stretches of the county, but not in the neighboring city.
Mixing the urban growth area with this mishmash of municipal and county boundaries necessarily results in even more confusion. We see this at the edge of the Clearview Cluster with a gap in the growth boundary between WA522 and the King County line, but plenty of development in the area. All this shows how the Growth Management Act is a fiction in all three parts of its title. It promotes sprawl. It exists in chaos. And it is fundamentally passive.
So what does this mean for extending the urban growth boundary around the Clearview Cluster? It means that it doesn’t matter. The study fell short in establishing a real boundary that was any less random than the existing growth boundary. Proprietary consultant heat maps and fiscal analysis are undone when a simple flip of the Terrain Switch on Google Maps shows that the study area should have included Elliott Road and High Bridge Road. The development schemes proposed rely on zoning that already can’t pay for itself and avoids questions about municipal governance. And 15 square miles of developable land built at any density that honestly recognizes climate change would be adding tens of thousands more people than the “urban” scenario. National capitals like Manila and Port-au-Prince can fit inside the boundaries of the Clearview Cluster.
The Clearview Cluster is already the suburbs, as is most of the Puget Sound region. Only the Growth Management Act fails to recognize and actually address this fact.