Despite negative pandemic rhetoric, demand for walkable urbanism remains high, creating a source of untapped potential growth in cities across the country.
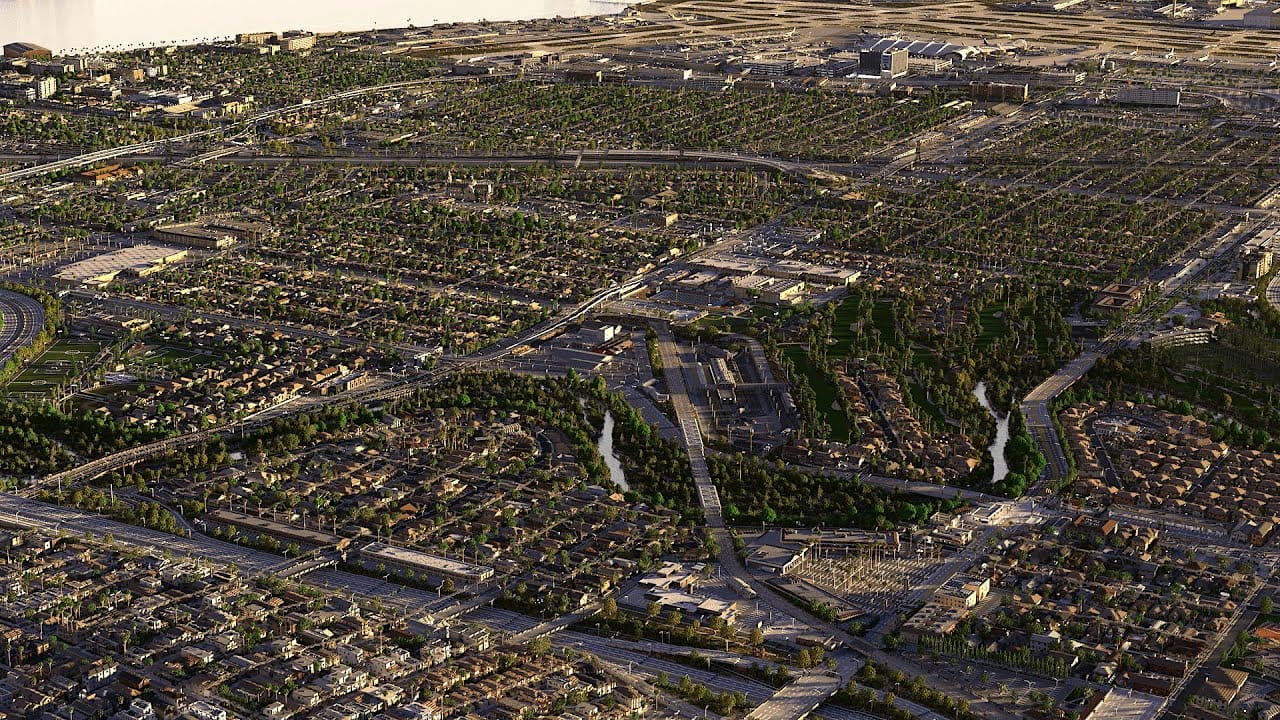
Take a moment to visualize a walkable neighborhood you are familiar with. It could be a dense downtown or a smaller scale neighborhood hub of homes and small businesses, either one works for this experiment. Now guess how much land in the 35 largest U.S. metro areas falls into that description. If you happen to guess 10%, go lower. Five percent? Lower still.
In 2023, Smart Growth America (SGA) estimates that walkable urban places account for only 1.2% of urban land use in the 35 largest U.S. metro areas. Now what would happen if these metro areas were to adjust their zoning so that walkable urbanism were to bump up to a still modest 6 or 8% of land use? The answer, according to the recent report 2023 Foot Traffic Ahead published by SGA, is that the U.S. would hold the keys to becoming a wealthier — and more socially equitable — society.
The report also shows that people continue to place a high value on walkable urbanism as evidenced by price premiums paid.
“The timing of this report can show the effects of the pandemic,” Calvin Gladney, President and CEO of SGA, said in a press conference. “And, you know, not to bury the lede, but one of the things that you’ll see is walkable urban places endured.”
Ranking cities by level of current walkability, future potential, and social equity
SGA’s report measures walkable urbanism by assessing how much office, retail, rental housing, and for-sale housing exists in their walkable urban places (WalkUPs). 2023 was the first time that for-sale housing was included in the report’s data.
The report uses census block groups to define areas — a finer grained approach than most real estate studies which divide areas into submarkets, such as the East End versus Downtown Manhattan in New York City, for example.
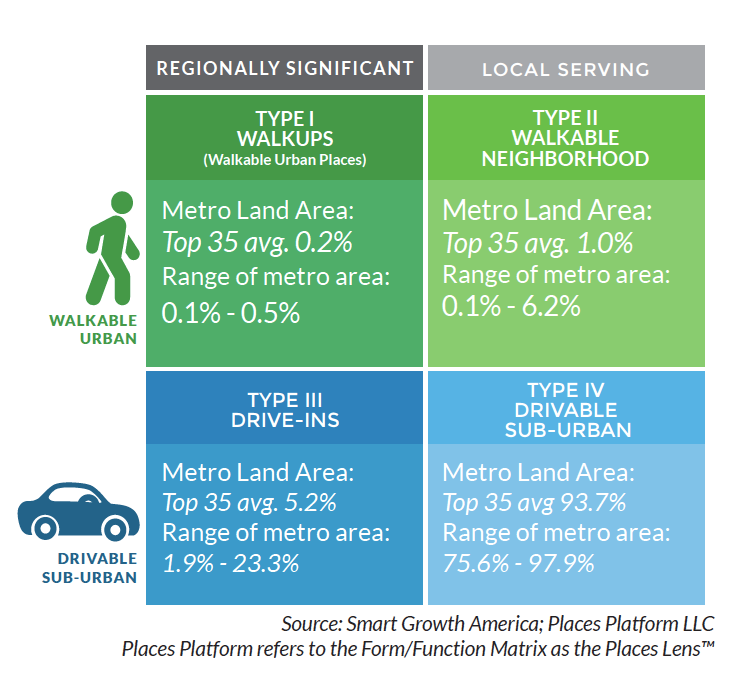
Levels of walkability in metro areas were broken down into four categories with Level 1 representing the highest level of walkable urbanism and Level 4 the lowest. In 2023, eight metro areas were assigned a Level 1 designation based on their Foot Traffic Ahead Index score.
Foot Traffic Ahead Walkability Rankings 2023 (Level 1, Most Walkable)
- New York, 100
- Boston, 74.3
- Washington D.C., 72.6
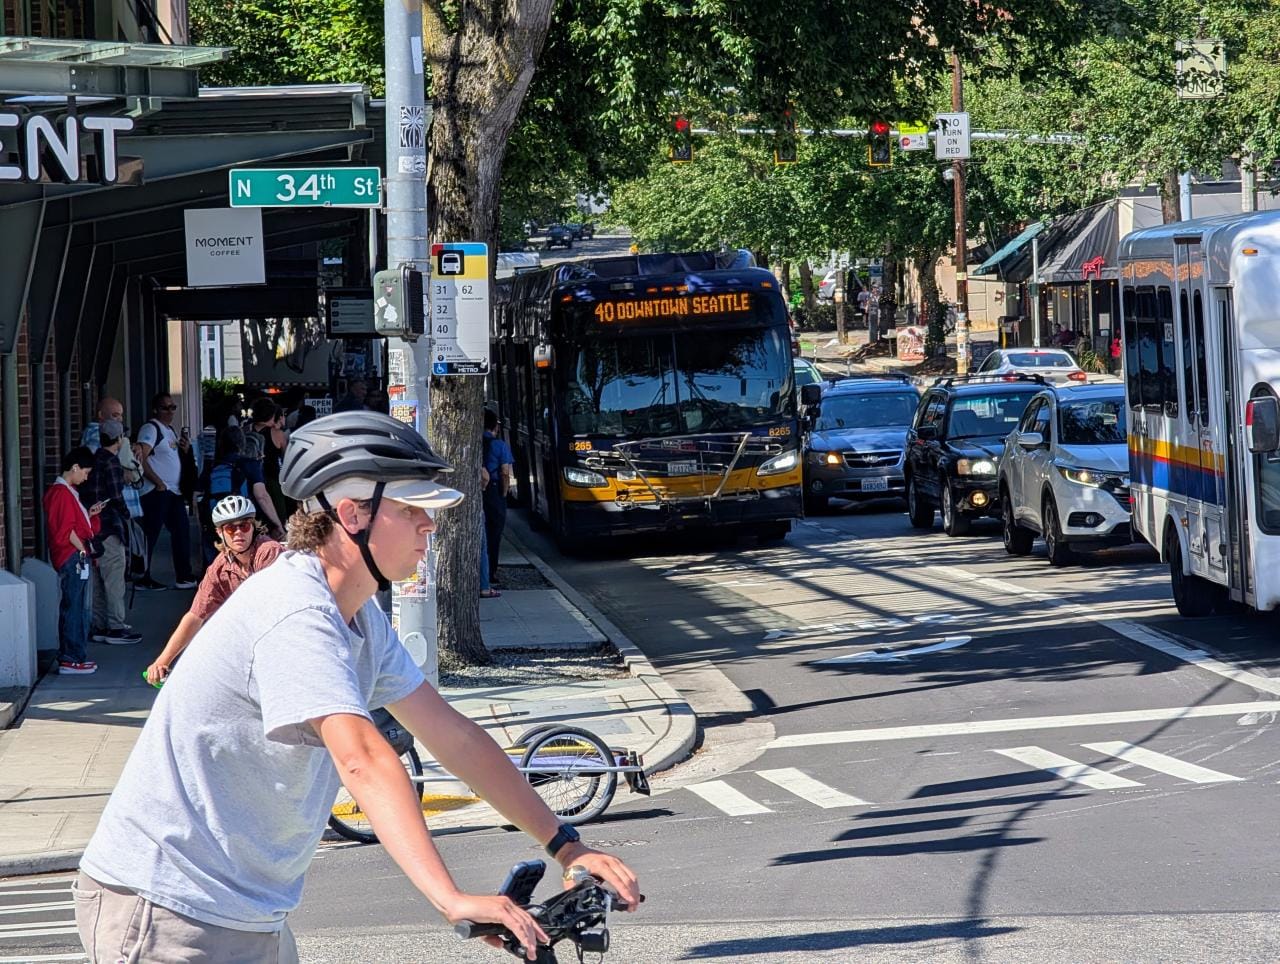
- Seattle, 69.4
- Portland, 68.5
- San Francisco, 66.2
- Chicago, 65.9
- Los Angeles, 59
The report also looks to the future of the 35 largest U.S. metro areas in its Future Growth Momentum rankings, which takes into account the price premiums paid for WalkUPs in a metro area, how much market share is shifting toward office and multi-family rental housing in WalkUPs, and the metro’s Standard Distance Index, which assesses whether the potential for future walkability is confined to a centralized core or dispersed across a broader area.
The Future Growth Momentum rankings have a generally negative relation with the overall Foot Traffic Ahead walkability rankings. For instance, the Tampa metro area, which topped the Future Growth Momentum ranking, came in at number 30 in the current walkability ranking. San Francisco stood out as the sole exception.
Top Ten Future Growth Momentum Rankings 2023
- Tampa, 67.1
- Nashville, 61.2
- Miami, 60.8
- San Francisco, 59.5
- San Diego, 57.9
- Dalla-Fort Worth, 57.9
- Atlanta, 55.3
- Orlando, 55.2
- Sacremento, 55
- San Antonio, 54.9
Finally, the report also issued rankings for a metro area’s Social Equity Index, measured by the affordability of WalkUPs, quality of transit they connect to, and how far people of different socio-economic and racial groups need to travel to access walkable urbanism.
Top Ten Social Equity Rankings 2023
- Cleveland, 61.8
- New York, 59.1
- Kansas City, 58.5
- Detroit, 58.2
- Philadelphia, 57.5
- Pittsburg, 57.3
- Baltimore, 56.4
- Washington D.C., 56.2
- Cincinnati, 55.5
- Minneapolis-St. Paul, 55.4
Substantial financial impact
Although it makes up just over one percent of our urban environment, data shows that walkable urbanism punches far above its weight economically. The report’s authors found that when they added up the estimated gross domestic product (GDP) in each census bureau group studied, walkable urban places in the largest 35 metros accounted for 19.1% of all U.S. real GDP.
“There’s been a lot of research looking at the net fiscal impact the profit that a city or county or town will make when they build walkable urban versus drivable suburban places,” Christopher Leinberger, one of 2023 Foot Traffic Ahead’s authors, said. “For instance, in Grand Rapids, a town both of us worked on about a year back, the walkable urban places were generating huge surpluses for the city net of all service costs.”
Leinberger attributes the positive economic impact of walkable urban places to a variety of factors, one of them being that denser neighborhoods generate more tax revenue while also being less costly for cities to service, resulting in funds that can be invested elsewhere in the city budget. “If they’re concentrated, it’s much more efficient. And that’s only part of how that money will be generated,” he said.
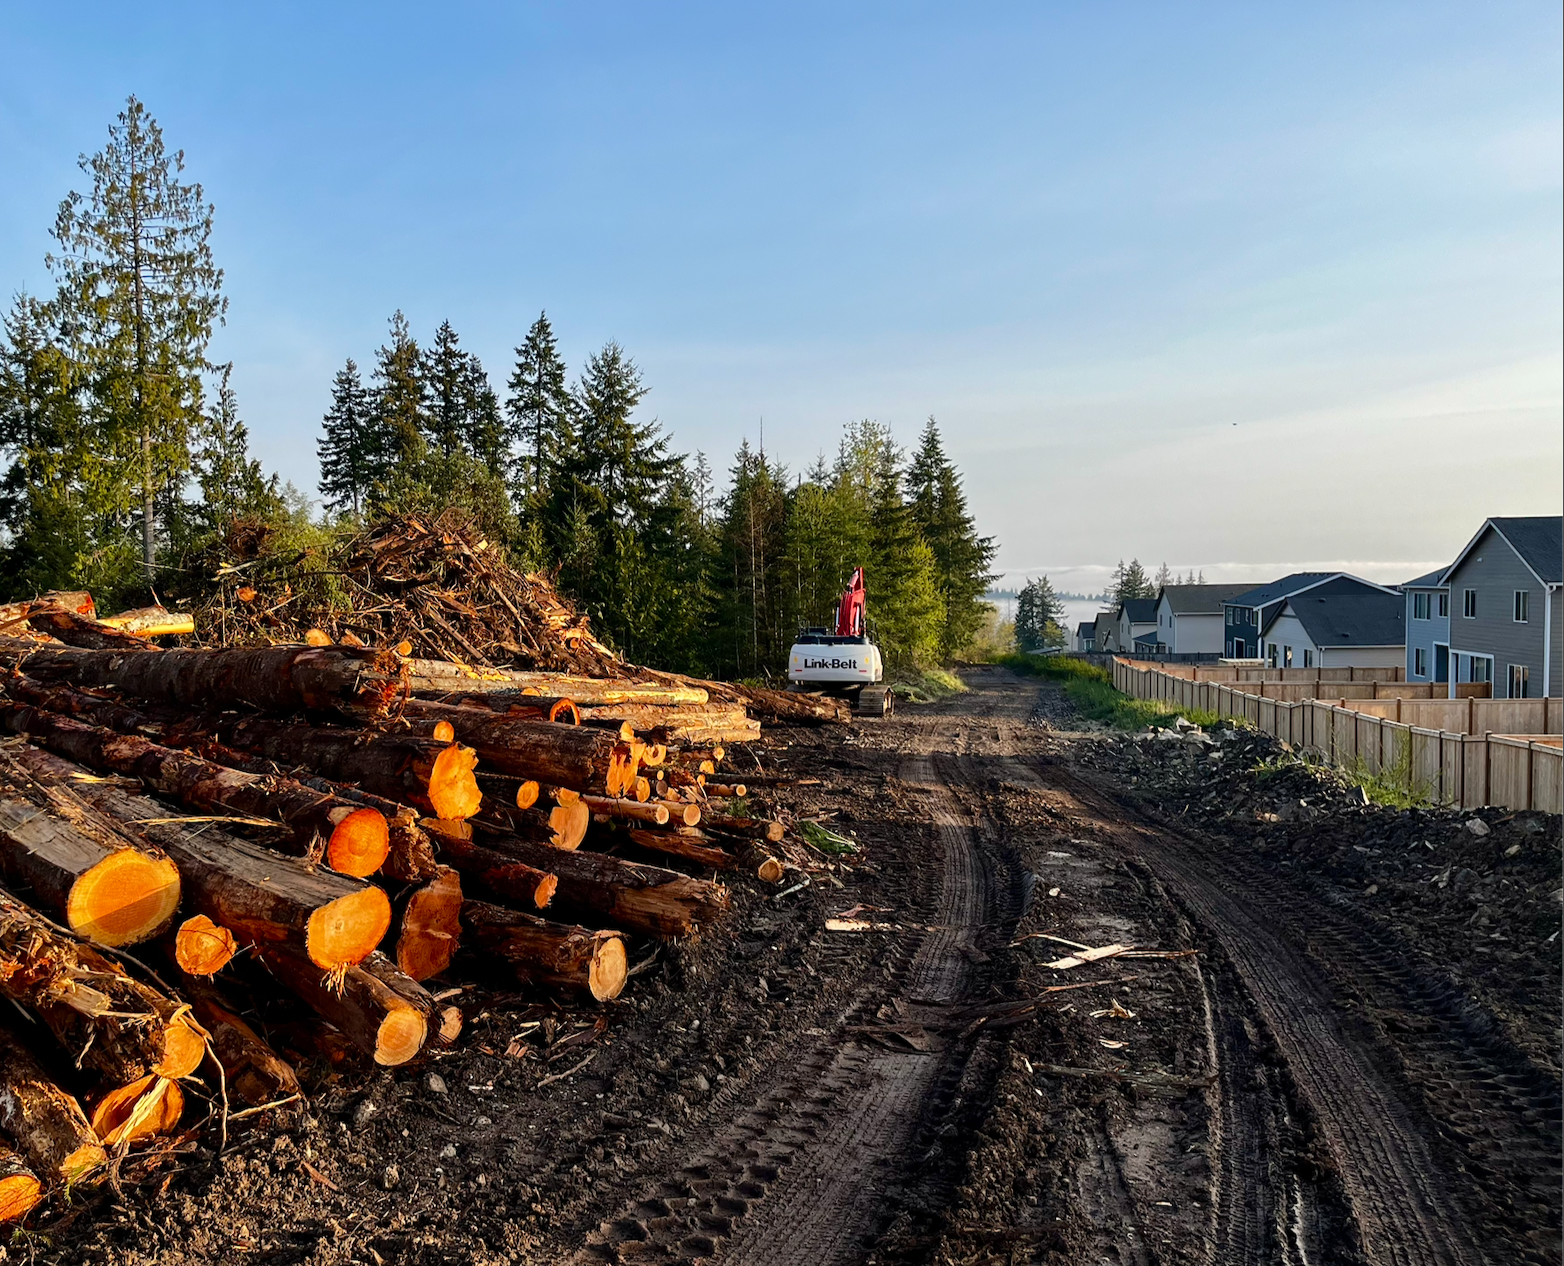
Walkable urban places cost less for upfront infrastructure, an important point to keep in mind as the U.S. continues to grapple with severe housing inaffordability in metro areas across the country. Data from taken Freddie Mac back in 2020 suggested that the U.S. was then about 3.8 million homes short of what it needed to ensure a healthy supply, a historic low that has only worsened in subsequent years as the pandemic and supply chain issues have slowed construction and stagnation has continued to prevail around updating zoning ordinances to allow for the creation of new housing in urban areas.
According to Leinberger, simply changing zoning to allow for walkable urbanism in 6 to 8% of urban areas in the 35 largest U.S. metros would solve the affordable housing crisis because doing so, he contends, would drive down the cost of land.
Gladney described how allowing for more density in urban areas would also allow for cities to use a variety of tools to capture the value of the new development and use it to create affordable housing.
“There’s a variety of terms that different jurisdictions use, but the basic concept is the same, which is to designate an area where you estimate the additional taxes that might be created by doing this new development and then designate a portion of those new taxes to be put into a pot to do a particular thing. So in Washington, D.C., the city has what’s called the housing production trust fund, and it essentially takes transfer taxes from real estate transactions and sets aside lots of those dollars specifically for affordable housing for a particular level of area median income folks in the area,” Gladney said.
Demand creates untapped potential
Data included in the Foot Traffic Ahead report pushes back against the narrative that people have been fleeing dense, walkable urban places since the onset of the Covid-19 pandemic. While the authors did find what they termed a “bump in the road” for office dominated downtowns, they largely found that overall walkable urbanism remained economically resilient.
“What we’re seeing is that people are choosing walkable urban places, and in fact that there’s pent up demand for the walkable urban places. We’re seeing tremendous price premiums over drivable suburban places. People are willing to pay more on a price per square foot basis,” Leinberger said. “Plus, walkable urban places are gaining market share very quickly, which means that drivable suburban places are losing market share.”
According to the report, across all 35 metro areas commercial real estate in WalkUps had price premiums over 40%, while for-sale housing had about a 34% premium when located in a walkable area.
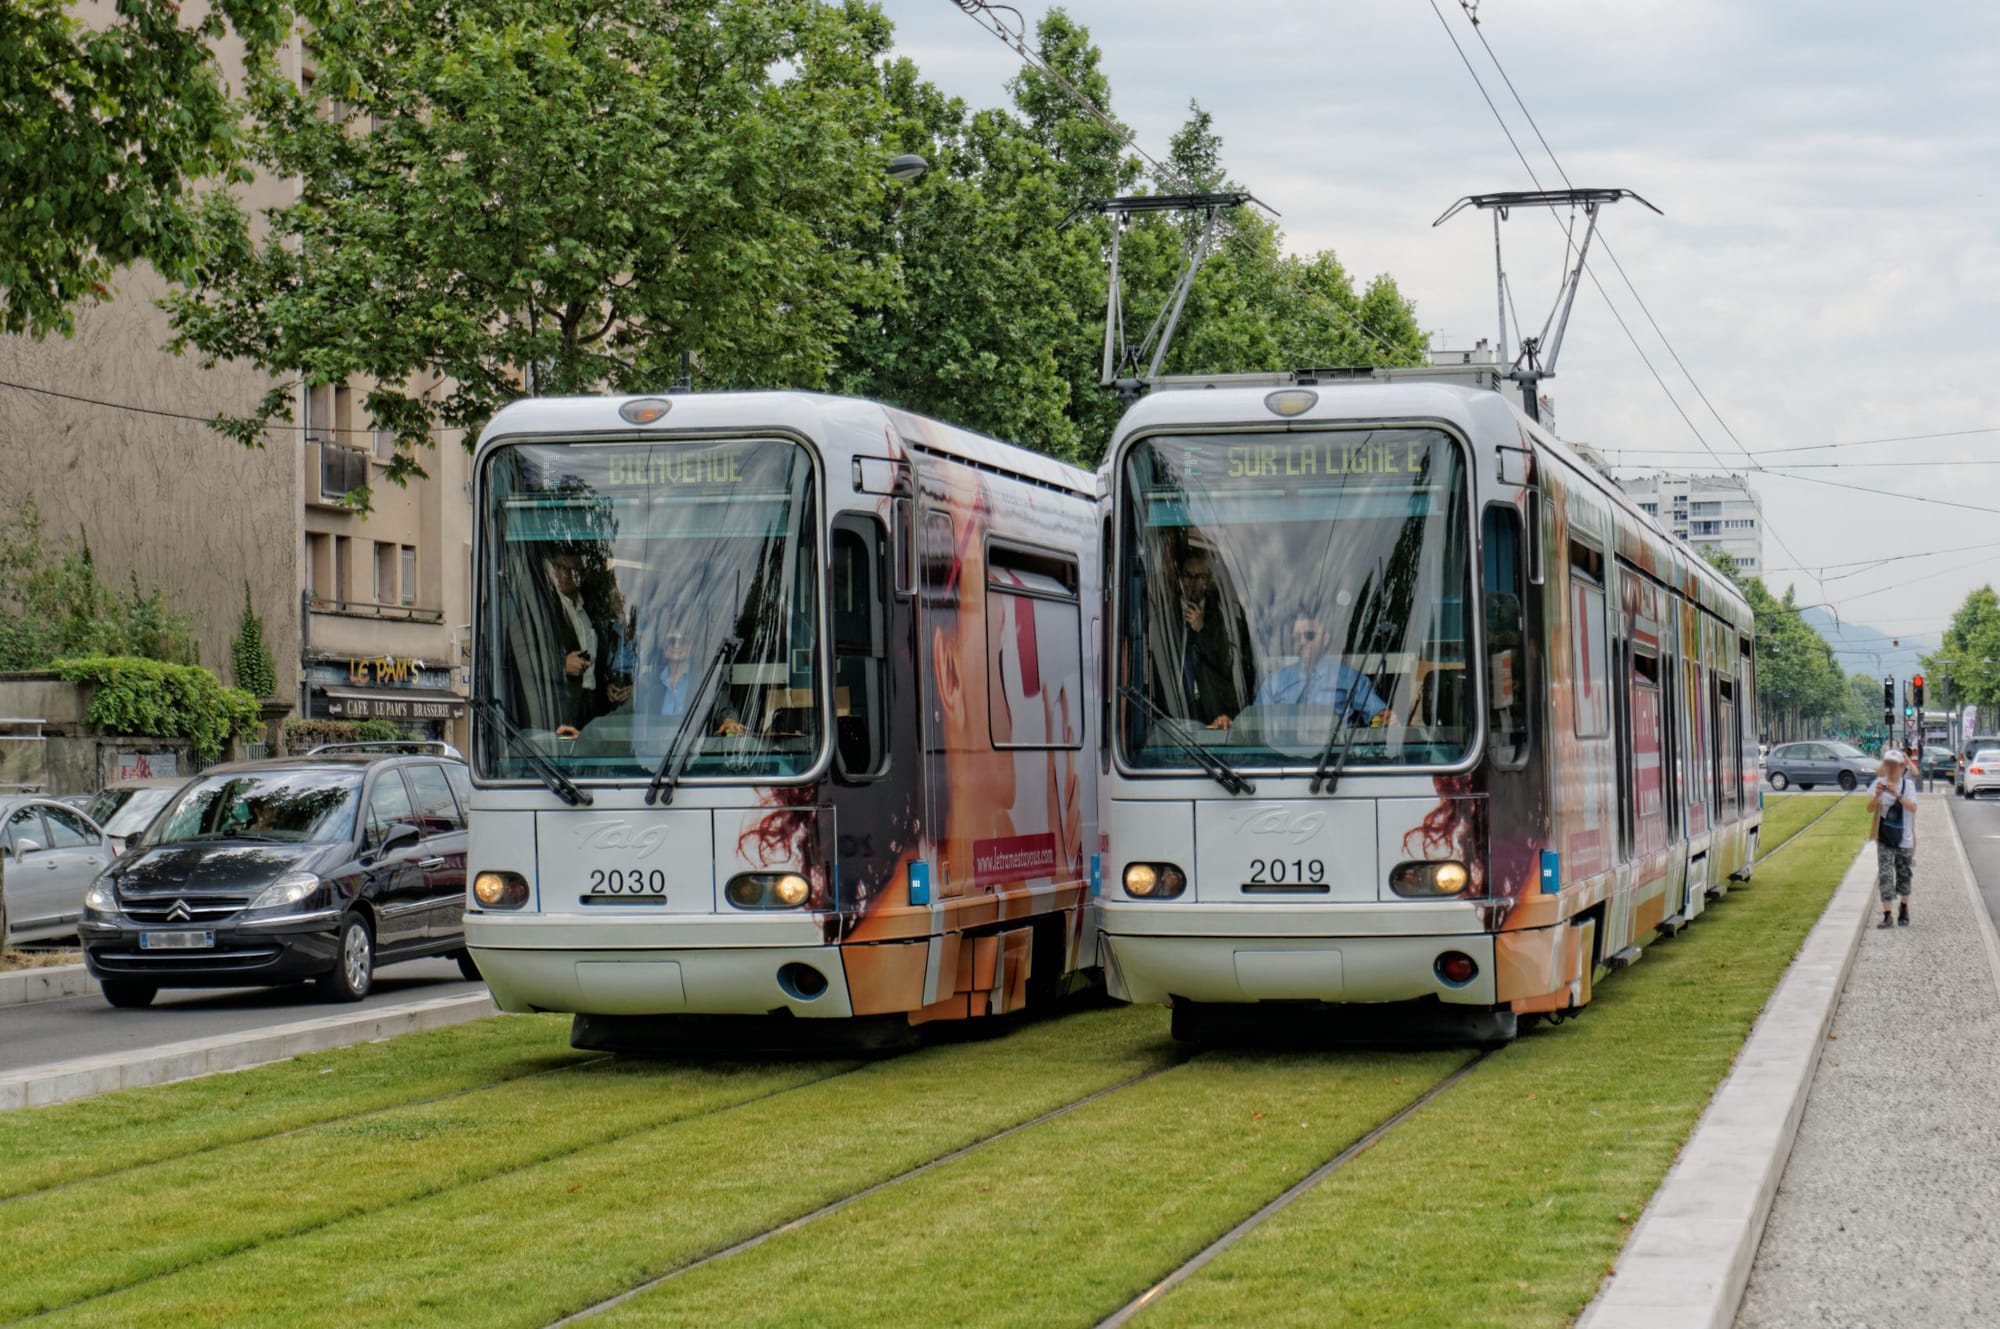
To better tap into this potential, the report’s authors recommended that cities advance zoning reforms to foster the growth of walkable urbanism, invest in transportation systems that encourage people to walk, bike, or take transit rather travel by car, preserve existing affordable housing and businesses, invest in new affordable housing, and plan for future climate impacts.
Doing so would eventually lead to a decrease in the price premiums paid for walkable urbanism — which Gladney expressed would represent a positive step forward for both society and the environment.
“We talk a lot about price premiums, but frankly if you can create more of these places and make sure they’re accessible to everyone and they’re affordable to more people, you actually get positive public health benefits. You actually create better sense of identity and community around the country,” Gladney said. “It’s really a great way to help address our climate crisis because the more people can walk and bike and get around without using a car and get to the jobs, services, and amenities that they need.”