
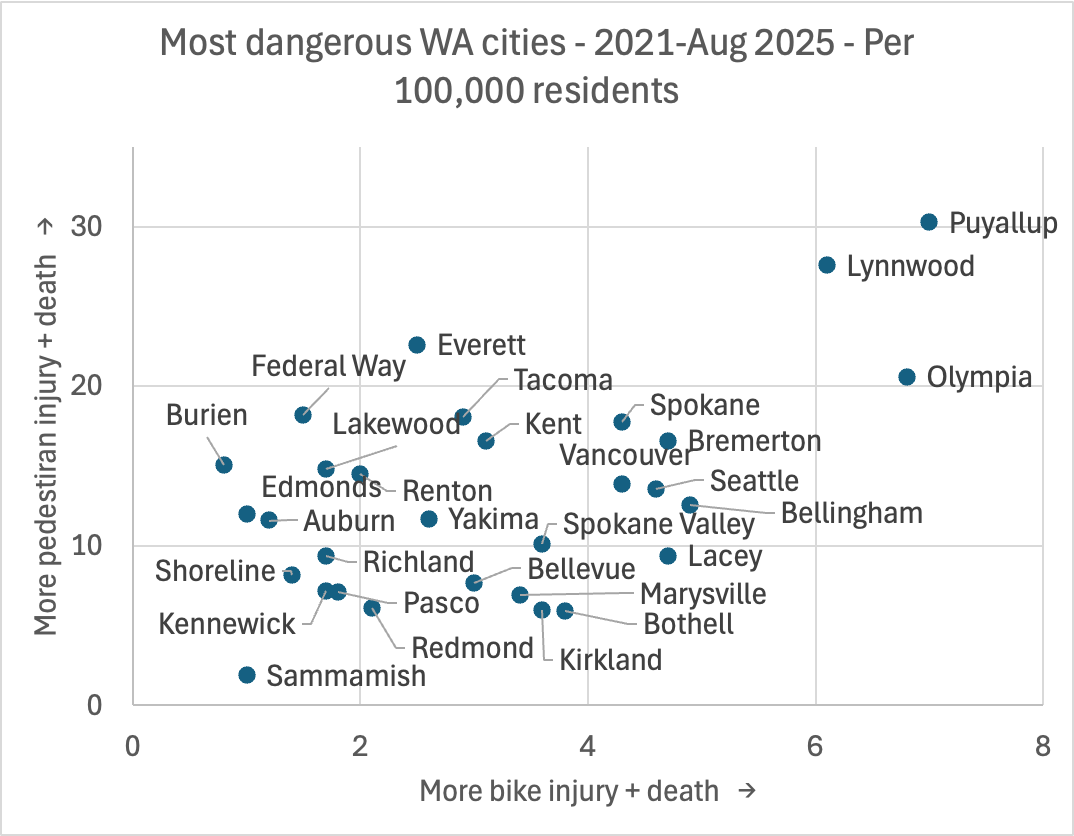
Which Washington cities have the deadliest streets and roads may surprise you. Puyallup, Lynnwood and Olympia are by far the most dangerous cities for people walking and biking, as measured by the per capita number of people killed or seriously injured by car-on-pedestrian or car-on-bike crashes since January 2021.
Conversely, Central Washington’s Tri-Cities of Pasco, Richland and Kennewick are statistically very safe for human-powered travelers, as are Sammamish and Shoreline. Seattle is the 7th most dangerous city to bike, per capita, and ranks 14th for people walking.

All this according to data from the Washington State Patrol’s Collision Analysis Tool (CAT), which tallies “collision data submitted by law enforcement officers.” This article quantifies the locations of car-on-bike or pedestrian collisions which are recorded by local police, sheriff or State Patrol as ‘seriously injury’ or ‘fatal’, between the dates January 1, 2021 and July 31, 2025.
Other key findings:
- Five Washington cities rate among the 10 most dangerous for both walking and biking: Puyallup, Lynnwood, Olympia, Bremerton and Spokane.
- Solo car commuting correlates strongly with deadly and serious crashes. Rush hour is the most deadly time and the more drivers, the worse for safety.
- Crashes on state highways are by far the most likely to result in serious injury or death. Crashes on city streets – though much more frequent – are much less deadly on average. County roads are in between.
- Several of the most dangerous cities are major employment centers, with car commuters flooding the streets, including Olympia, Bremerton and Seattle.
Dangerous cities for people walking
Lynnwood and Puyallup are the most dangerous places to walk in Washington State by a wide margin, with Everett and Olympia close behind. Pedestrians are almost never maimed or killed in Sammamish, perhaps because people rarely walk there. Several east-of-Seattle suburbs have very low pedestrian carnage rates, including Bothell, Kirkland, Redmond and Bellevue. Seattle is close to the median for the 30 cities studied. Click here for an interactive map of WA’ Cities, ranked by walking danger.

Dangerous cities for people riding bikes
Washington’s capital city of Olympia suffers a very high rate of bike carnage, along with Puyallup and Lynwood. Bellingham and Bremerton round out the Top 5 of Shame. Seattle is 7th worst. The top 5 safest are Burien, Sammamish, Edmonds, Auburn and Shoreline. As with pedestrians, the Tri-Cities of Richland, Kennewick and Pasco kill and maim far fewer cyclists than average. Click here for an interactive map of WA’ Cities, ranked by biking danger.

Pedestrian and bike carnage vs how people get to work
Cities where fewer commuters drive alone are safer for people walking and biking. This result is intuitive; the more cars on the road, the more likely they are to hit someone walking or biking. The correlation for car-on-pedestrian crashes (R = 0.43) is stronger than for car-on-bike ones (R = 0.26). Commuter data is from the U.S. Census Bureau’s American Community Survey, 2023.


Work-from-home vs road carnage has an even stronger correlation. Cities with a high percentage of work-from-home have a lower rate of car-on-pedestrian (R = –0.53) and car-on-bike (R = -0.36). Again the correlation is intuitive, people who don’t leave their houses during rush hour are less likely to get hurt by a driver. Sammamish’s very low rate of crashes seems strongly correlated to its extremely high rate of people who work from home and thus very low rate of drivers out causing crashes.


What type of streets kill and maim the most people?
Although the vast majority of car-on-human crashes occur on city streets, state highways are much more likely to kill or seriously injure a pedestrian or cyclist, likely because of high speeds and design flaws, as The Urbanist has reported. Proportionally, more cyclists than pedestrians are killed or maimed on county roads, likely because cyclists choose county roads for commuting and cycling, while walking is rare in remote areas.
But state highways are very, very dangerous for people outside of cars. A car-on-human collision on a state highway is 2.5 times more likely to kill or seriously injure a pedestrian than a collision on a city street. A county road is 1.3 times more likely to kill or maim a cyclist. A car-on-pedestrian crash is much more likely to be fatal or serious than a car-on-bike crash.

It’s not getting better
If you’re looking for good news in this report, there’s very little. But here’s one improving trend: there are fewer collisions between cyclists and pedestrians now, than before the pandemic. But the number of car-on-human crashes is returning to pre-pandemic highs, and the rate at which vulnerable road users are being killed and maimed is staying high.


Unfortunately, those collisions are getting more dangerous – a single collision is significantly more likely to cause a fatal or serious injury. In 2018 and 2019, about 1 out of 5 (19%) of car-on-pedestrians and 1 out of 11 (9%) of car-on-cyclist crashes caused a death or serious injury. Starting in 2020, those rates of fatal/serious injuries surged, to 1 in 4 pedestrians (25%) and 15% (1 in 7). That means even while there are fewer total crashes, any given car-on-human crash is much more likely to cause severe injury or death.
About the data:
Anytime data is presented, it can be warped or manipulated to bias the information. Below is an explanation of choices I made with the data. All these data are public available at https://fortress.wa.gov/wsp/collisionanalysistool/. You’re more than welcome to check or expand upon my work.
Why focus on Jan 2021-Aug 2025
I attempted to look at the entire post-pandemic era at one time. 2020 was a very strange year, with traffic significantly reduced as people sheltered in place, worked from home and skipped vacations, so 2020 is excluded from most data shown here. Comparing 2018 & 2019 as a pre-pandemic baseline allows for comparisons with post-pandemic times.
Why combine fatal and serious injury data?
Most crash analyses, like the Washington Traffic Safety Commission’s data, focus exclusively on fatalities. But traffic deaths are relatively rare, there were only 13 bike deaths in 2024, smaller cities may go years between a bike death. By adding in the 171 serious bike injuries, we get a fuller picture of where and how bad cycling danger is. Besides, the difference between a very serious car-on-human injury and a deadly crash is often a matter of luck. If a car crushes your leg, not your head, you live. Lucky you.
How are injury severities tabulated?
Injury severity is reported by police agencies
How are city or street locations tabulated?
By police agencies. It is likely that crashes labeled in a city, actually occurred just outside of city limits, in unincorporated areas. I made no attempt to correct for that. Sorry.
Is WSP CAT data easy to work with?
No it is not. The data has duplicates which need to be eliminated. Errors on my part are possible in that process. Furthermore, the data is gathered by police officers who may make mistakes filing reports. The WSP data is cleaned up by data experts at the Washington Traffic Safety Commission, which releases an official, annual report. But those data don’t include data on non-fatal crashes. There are discrepancies – WTSC counted 168 traffic fatalities in 2024, my report tallies 170. Presumably their number is more accurate. Sorry.
Is it fair to treat all cities equally?
Probably not. The per capita ‘denominator’ only takes into account the city’s population, not others who visit the city. Seattle hosts huge events, sees tons of tourists and has popular bike/scooter share, all of which pushes up the number of people killed or maimed in the city, making it seem more dangerous in the stats. Smaller cities with large employment bases – like Olympia, Bremerton and Everett – probably suffer similar effects from inbound workers. A different ‘denominator’ would be the count of all car crashes, which would give a baseline of street danger, as separate from danger bikes/peds face.


