Approximately 35% of the land area of Seattle constitutes public right-of-way. Today, most of this space is dedicated to general purpose lanes and parking and is utilized mostly by single occupancy vehicles. Yet, as the city becomes denser, we are finding this configuration to be inadequate in serving its changing needs. The transportation supply it provides no longer meets the demand as evident by growing congestion. This is only the result of a good thing—strong job growth and record-low unemployment. But it is also a sign that we should consider alternative street configurations.
The many uses of a right of way
Fundamentally, right-of-way is just public land. And besides providing a pathway between buildings, it has historically also served as space for markets, social gathering, children’s play areas, and been critical for community building. The crowding out of these functions by transportation is in part natural, as fueled by growing population, but mostly a function of decades of deliberate car-centric policies. To understand this problem better, below we will calculate how many people actually benefit from the same 10 feet of right-of-way depending on its use: parking lanes, general purpose travel lanes, bike lanes, bus lanes, and even dedicated space for light rail.
Vehicle Travel Lane
The most common use of right-of-way, a vehicle travel lane can move between 500 and 900 cars per hour. It’s interesting to see that the lower the speed of travel, the more vehicles it can move per hour due to lower following distances:

So at 25 mph, lane capacity is maximized at 900 vehicles per hour. Besides vastly increased safety, this is yet another argument for 25 mph speed limits. Given the average occupancy of vehicles at 1.6 persons (based on the PSRC Transportation 2040 Final Environmental Impact Statement), the throughput is:
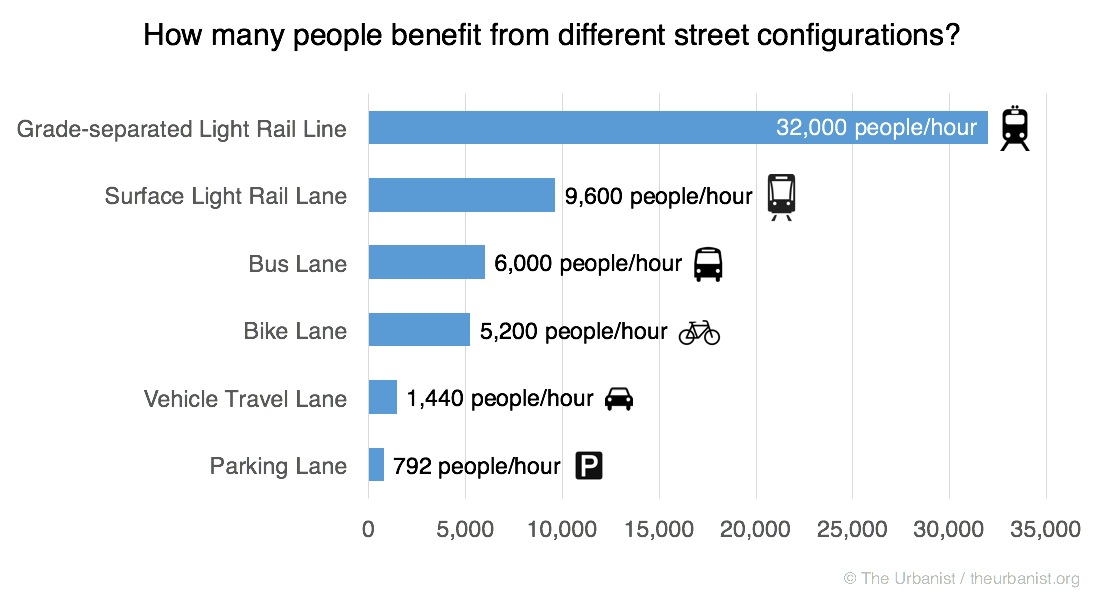
Vehicle Travel Lane: 1,440 people per hour
Vehicle Parking Lane
Parking, the topic of never-ending neighborhood feuds and controversies… How many people do actually benefit from a parking lane? This is not as easy to evaluate as measuring the throughput of movement. Parking only makes sense as a whole corridor, as opposed to as a point.
To make sense of this, we start with the average non-work trip length of 4.5 miles based on the PSRC Transportation 2040 Final EIS. We use non-work trips, as work trips likely have a significant highway component where there is no parking regardless.
How many parking spots do we have on 4.5 miles of road (per direction)? Given space for crosswalks and intersections, parking can take up about three-quarters of a corridor, or in this case 3.38 miles. Assuming a standard length of 18 feet per parking spot, we have 990 spots. How many people can benefit from them depends on the average parking duration and average occupancy of vehicles.
A Seattle Department of Transportation (SDOT) parking study from 2002 shows an average parking duration across all zones at 2.3 hours. After discussing this with people in the know, I understand the average rate may have gone down a bit, but not significantly, so we can assume it is 2 hours.
So, the 990 spots can be used by roughly 495 cars per hour and given the average occupancy of vehicles at 1.6 persons per vehicle we get:
Vehicle Parking Lane: 792 people / hour
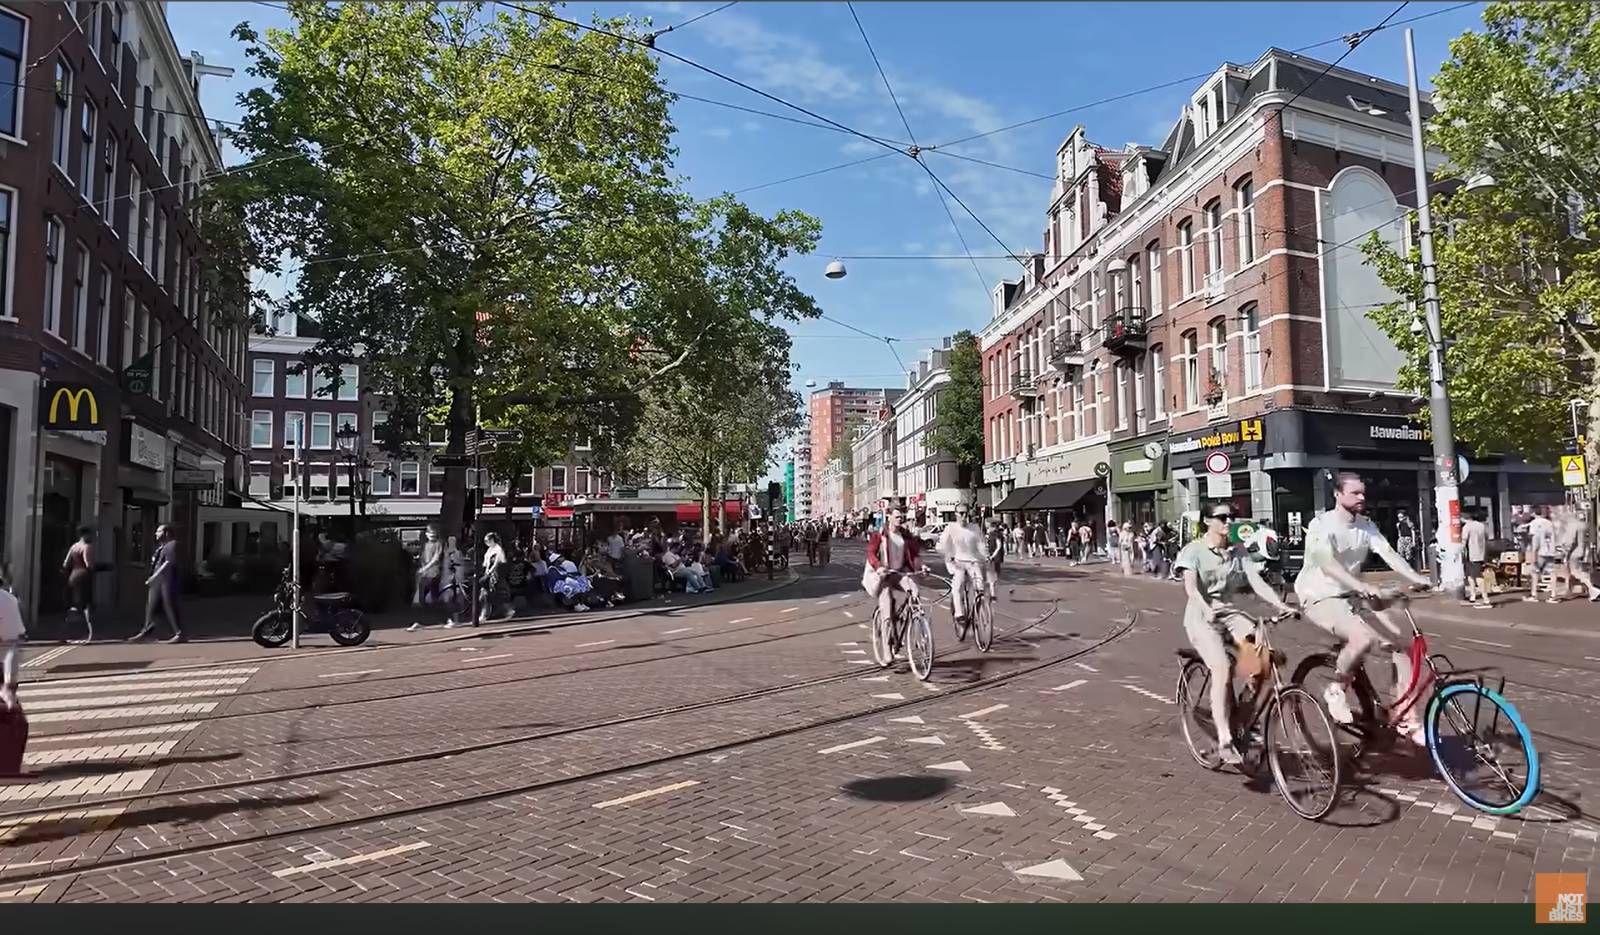
Bike Lane
Bicycle lane throughput varies based on width. A study from Davis, California reports the capacity as 2,600 bicycles per hour per 3.3 feet of lane while most other studies have actually found higher throughputs, so we’ll use this as a lower bound.
Regardless of whether bike lanes are installed in place of 8-foot parking lanes or up to 11-foot travel lanes, we can assume at least two bike lanes per original lane. This gives us:
Bike Lane: 5,200 people / hour
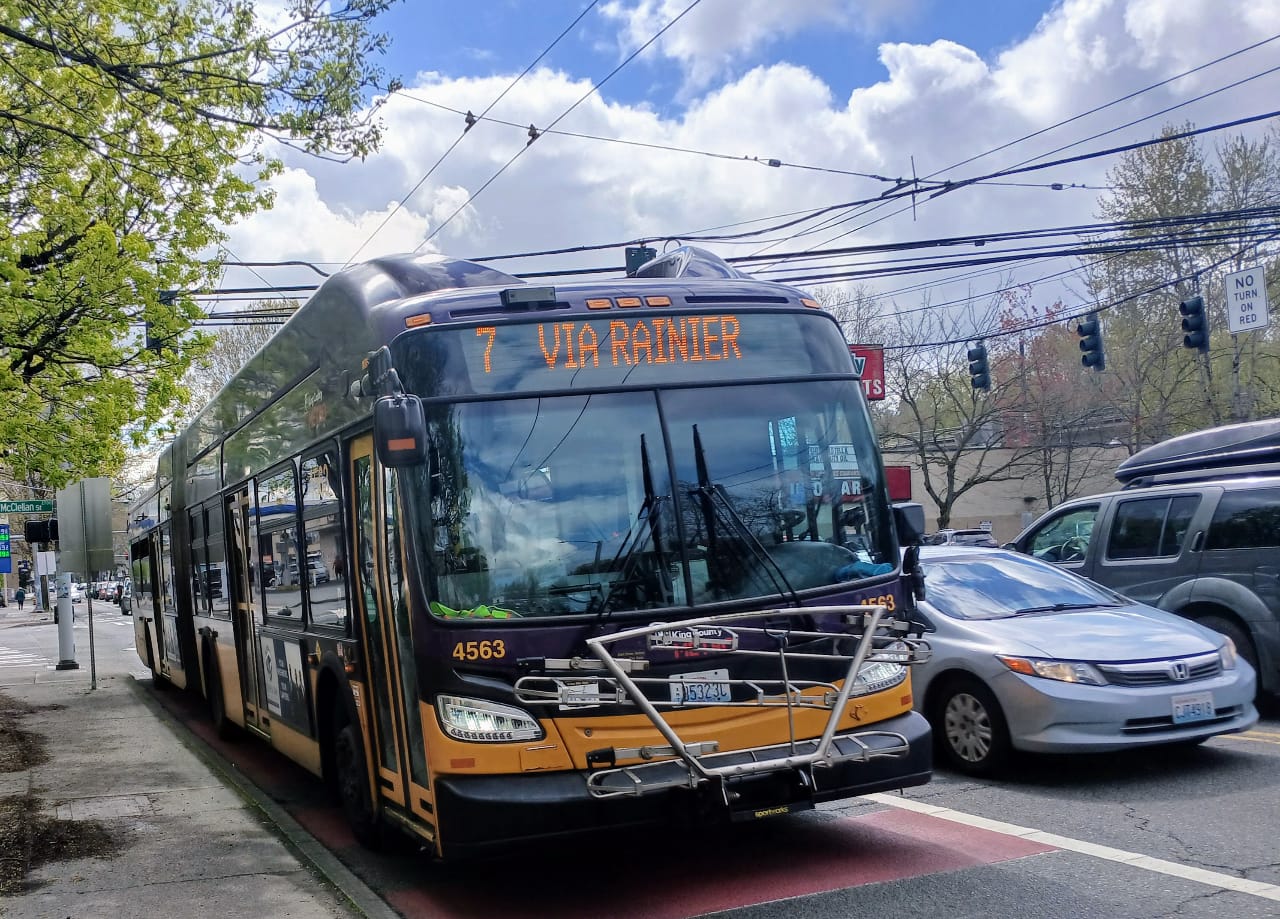
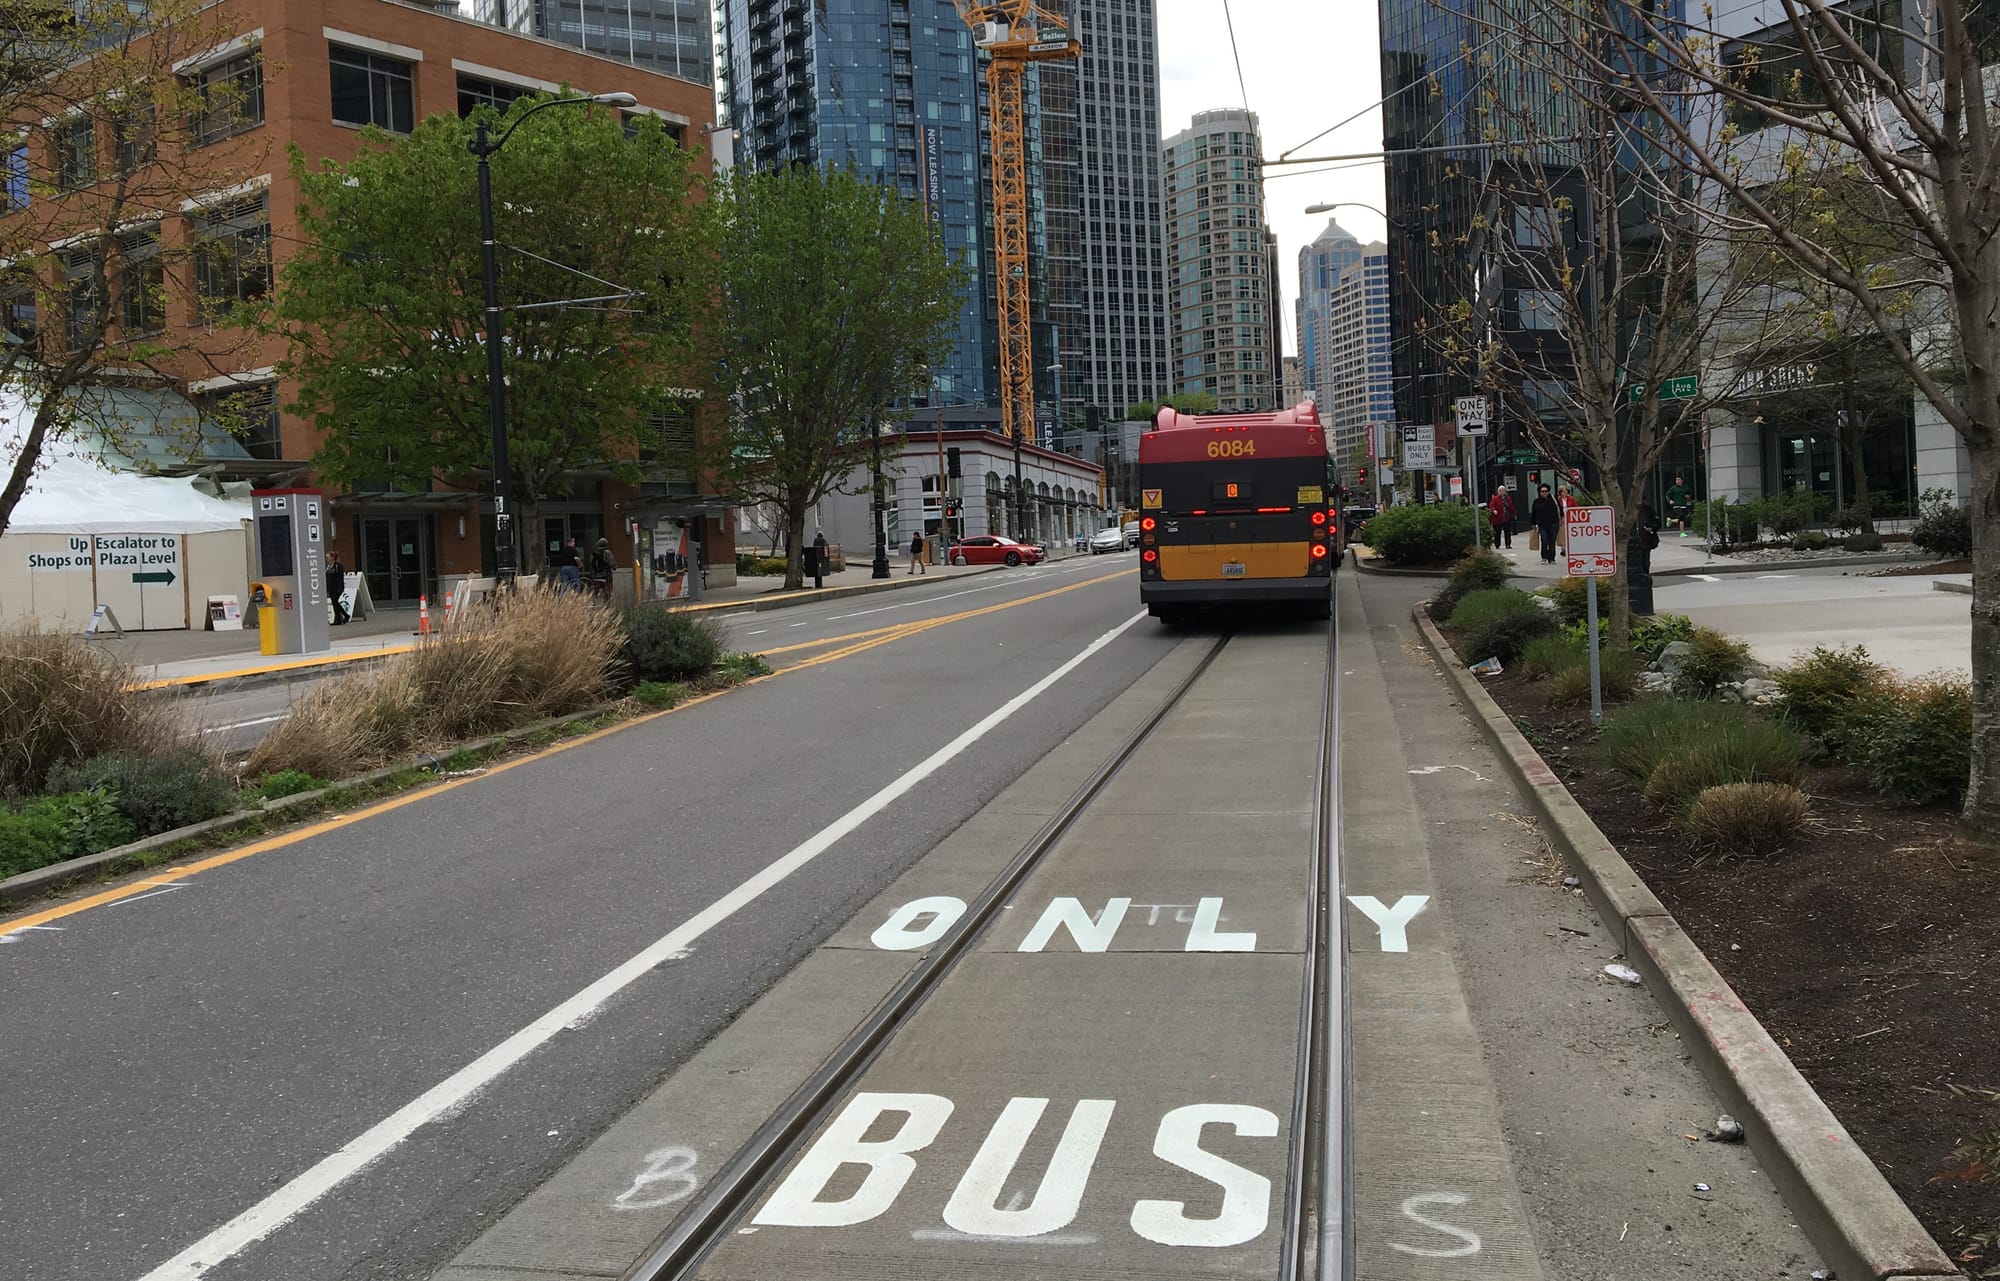
Bus Lane
While we already have a number for cars per hour that can use a lane, we can’t just apply it to buses. Buses are longer (60 feet for an articulated bus versus 15 feet for the average car) and more importantly, make frequent and long stops. The Transit Capacity and Quality of Service Manual has guidance on the average number of buses that can use a lane with everything considered.
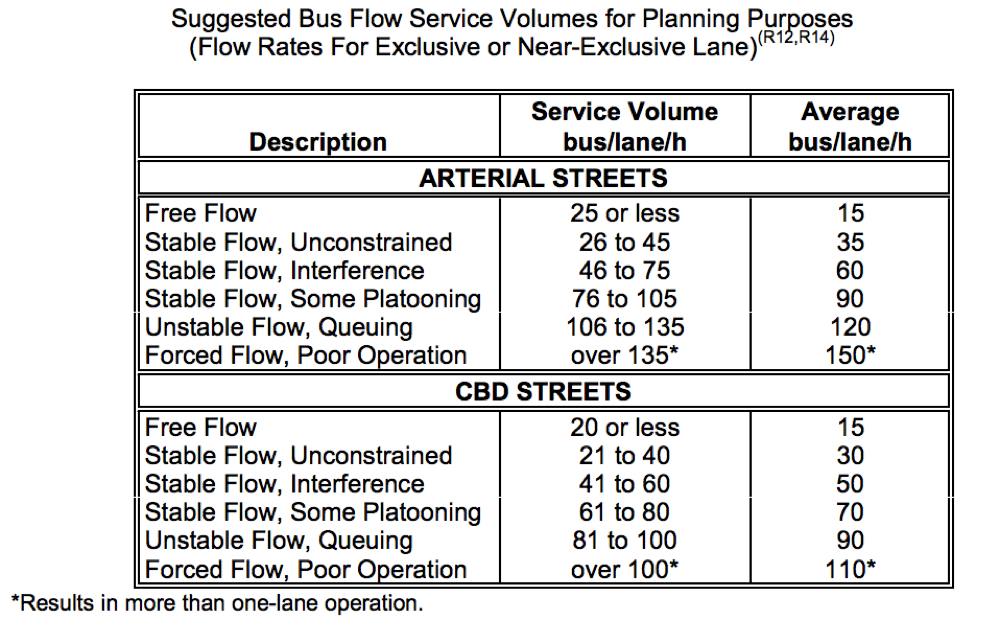
Assuming “Stable Flow, Interference” to avoid bus bunching and too much of a speed decrease, the lower bound for CBD streets is 50 buses per hour per lane. It should be noted that the SDOT-operated bus lanes in Downtown Seattle carry up to 190 buses per hour, but they do so with significant delay through that section. At rush hour, it can easily take 3 times longer to go through Third Avenue due to the heavy bus congestion.
A 60-foot articulated low-floor bus typically has 65 seats and can carry 55 standees (per manufacturer specification) meaning that we get a throughput of:
Bus Lane: 6,000 people / hour
So a bus lane easily serves 4 times more people than a general purpose vehicle travel lane!
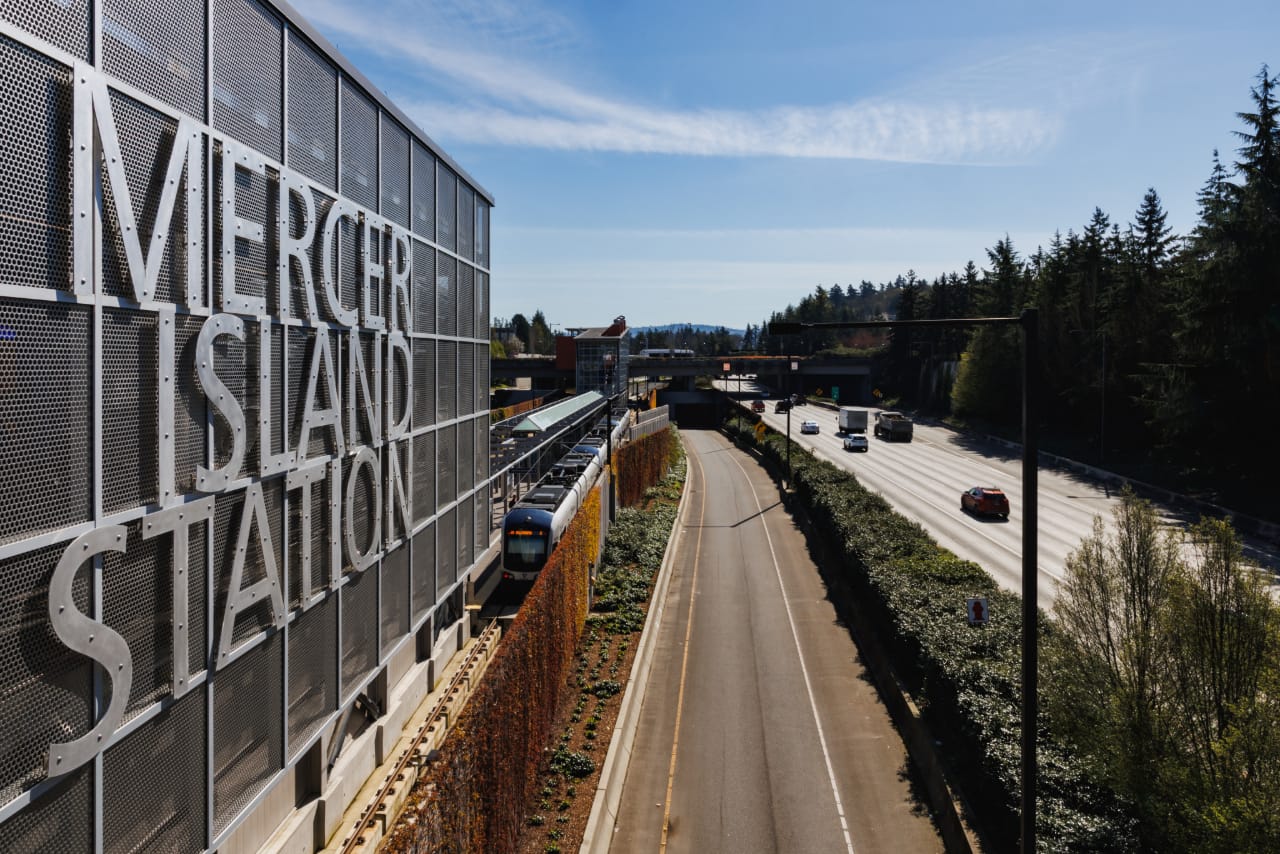
Surface Light Rail Lane
Light rail lanes are similar to bus lanes, but allow for even longer vehicles yet fewer of them per hour. Train length is limited by the length of blocks as otherwise trains would stick out and block intersections. Blocks in Seattle vary from 200 to 450 feet and they vary by route taken.
So using 95-foot Link Light Rail trains for the example, a short block can fit two of them. They fit 200 people each (74 seated, 126 standing per specifications).
The highest frequency at which any US light rail line operates is 2.5 minutes or 24 trains per hour. So with that we get:
Surface Light Rail Lane: 9,600 people / hour
Note how that is more than a bus lane despite running half the number of vehicles per hour. That’s because of passenger density: a platoon of buses is less dense due to required following distance. It’s also important to note that for some corridors in Seattle, one could achieve 19,200 people per hour by running 4-car trains with no degradation of service quality.
Grade-Separated Light Rail Line
I am adding this for comparison purposes only, especially as Sound Transit 3 is approaching. A fully grade-separated rail line is one that is either underground or elevated (or otherwise has no grade crossings). Frequency can be brought down to 1.5 minutes and trains can be of any length desired. Sound Transit typically designs for 4-car trains, which are 380 feet long.
Grade-Separated Light Rail Line: 32,000 people / hour
Whoa. So a light rail tunnel/viaduct can move as many people as 22 car lanes! This is really why it’s important to approve ST3 regardless of the status of bus rapid transit (BRT) projects in Seattle. A BRT line will never come close to moving this amount of people. In fact, the busiest bus line between the US and Canada is the 99 B-Line in Vancouver, which moves about 50,000 people per day (not hour!) and Vancouver is planning a subway along its length because it will actually be cheaper to operate.
At the same time, approving bus lanes for a BRT line can deliver a benefit in a couple of years as opposed to 20 to 30 years for light rail and can be done on far more corridors than we can afford light rail on.
A few words about pedestrian space
While sidewalks are really efficient at moving people (11 feet would move up to 15,000 people per hour assuming 3x3ft space per person and 3 mph), we shouldn’t think of them as just that.
Pedestrian space forms the public realm—the places where people meet, share experiences, and identify with. It’s the base connective tissue that enables the kinds of interactions to happen and enable a city’s economic productivity to grow superlinearly by 130% when population only doubles.
A parklet is a great example of a public realm element. When used by a restaurant (so called streatery), for example, it can seat 5 to 15 people depending on configuration. Assuming that restaurant patrons spend an average of 2 hours at the restaurant, the same as the average parking duration, we can immediately see that a parklet with 10 people is 10 times more efficient than a parking spot.
What’s better than a disconnected set of parklets abutting traffic is simply wider sidewalks. They enable amenities like outdoor seating, art, greenery to be built right into the sidewalk, and greatly improve the walkability of an area.
The tally
No calculation error, or technological improvement can boost the space efficiency of car-based usage so it catches up with the lead of other modes (and I am using conservative estimates for these other modes). It is clearly the least space-efficient and one must really desire to be part of the flat-earth society to argue this point.
Furthermore, the ever-controversial parking is at the very bottom of the list. Street space dedicated to parking serves almost 8 times fewer people than a bus lane and nearly 7 times fewer than a bicycle lane. Preserving parking in-lieu of a transit or bike lanes is really an attempt to keep our transportation system as inefficient and gridlocked as possible.
Why not more roads
Whenever you see congestion on the street, it is a sign of only one thing—that the transportation demand on that street is exceeding the supply and that more supply needs to be provided. Now we could build more supply off-street, but it is extremely expensive:
- Tunneling: Seattle has 1,540 miles of arterials and for $1.55 billion per mile (SR-99 cost) we can tunnel under each street for a bargain-basement price of $2.4 trillion. I’m sure the required 2,400-year tax levy will pass just fine.
- Building viaducts: a lot cheaper, but still exorbitantly expensive at $500 billion or so—for a brutalist sun-blocking concrete monstrosity on top of every arterial.
- Or we could, take a (parking) lane and switch it to a denser mode…
More on parking
The other aspect of parking is that it really doesn’t have to be on the street. A multi-floor garage stacks cars on top of each other to bring the land utilization of parking more in tune with the denser transportation modes. This frees up space that can then be provided to increase the transportation capacity of the corridor.
But how do we come up with the garages?
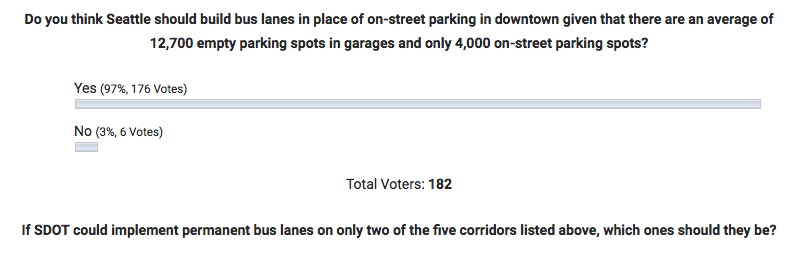
First, in Central Seattle (Downtown, Denny Triangle, Belltown, Pioneer Square, Chinatown) we have 237 parking garages with 44,000 parking spaces. In comparison, we have around 4,000 on-street parking meters. Parking garages are on average 71% full, meaning we have more than 12,700 empty spots, more than sufficient to cover for all street parking if repurposed.
Within neighborhoods, most new construction apartments build more off-street parking than required. According to a recent city analysis, 75% of the 219 new developments built between 2012 and 2015 in areas where no parking is required provide parking anyway. These unused spots can be put on the market and some apartment management companies (e.g., Equity Residential) are already doing that.
Switching a lane to a denser mode
So how does this work? Let’s say we have 2 lanes per direction and supply equals demand. There’s no congestion and we have some buses mixed in. We move 1,800 vehicles split as 1,785 cars + 15 buses for a total of 4,581 people per hour.
But as demand increases beyond this point, we simply get congestion. We know that with buses we can move 4 times more people per lane, but why would people switch from a car to a bus, if they get no benefit? Why should I give up my car when somebody else could do that?
So we take one lane and switch that to a bus-only or HOV 3+ lane. If we move 900 cars + 27 buses per hour we’ll move the same 4,581 people with no congestion. But we now have the freedom to scale up to 50 buses per hour and move 7,440 people per hour with still no congestion.
In other words, we increased the corridor’s capacity by 62%, equivalent to adding another lane, by spending money only on paint and funding increased bus service.
Reasons to switch
The reason why such a switch makes sense is nothing more but supply and demand. You can only fit so many vehicles in a stretch of road and nobody wants to pay for an underground highway under every arterial.
A switch is not being made for environmental reasons, for social justice reasons, or because somebody has an evil agenda. It’s made because of math, plain and simple.
On the flip side, when supply exceeds demand, not switching a lane over to a denser mode is nothing short of undemocratic tyranny. And that tyranny, when also applied to housing, is a key limiter of economic growth and the top generator of inequality in our region.
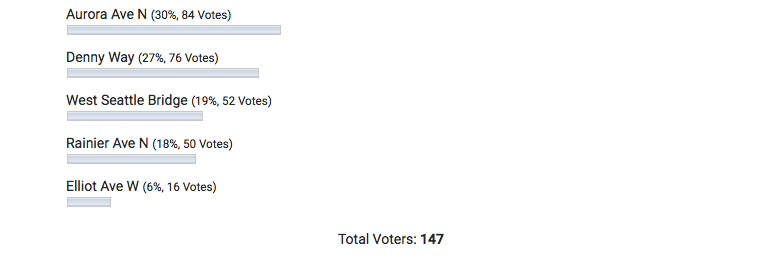
Where transit lanes are no-brainers
If the theory above doesn’t persuade you, let’s look at actual practical examples from Seattle. The following is a list of streets where the volume of transit riders exceeds the volume of non-transit riders:
| Street | Vehicles / lane / day | Transit ridership / day | Transit Lines | Transit Lane Status |
| Aurora Ave N, south of Fremont |
16,750 | 28,300 | E, 5, 16, 26x, 28x | Peak-only, none on Ship Canal bridge |
| West Seattle Bridge | 17,883 | 23,900 | C, 120, 21x, 37, 55, 56, 57, 116, 116x, 118, 118x, 119, 119x | 1/4 eastbound only |
| Rainier Ave N | 9,150 | 15,900 | 7, 9 | None |
| Elliot Ave W | 12,225 | 13,600 | D, 15X, 17X, 18X | 7-9a south, 7-9a + 3-7p north |
| Denny Way | 8,525 | 10,300 | 8 | None |
(Data is from 2014, latest available.)
So in every one of these cases, a permanent transit-only lane would move more people than a general purpose lane. Moreover, as buses become more reliable and faster, it is expected that more people will switch to transit, resulting in an overall expansion of people moved across the corridor, equivalent to widening the road, but with almost none of the cost as exemplified earlier.
Ultimately, it seems like a no-brainer—SDOT should study every one of these corridors for permanent 24-hour transit or HOV 3+ lanes and implement them as soon as financially possible. By approving Move Seattle, people clearly indicated their support for this approach. If you’re tired of waiting for this to happen, here’s a few things you can do:
- Send an e-mail to a City Councilmember representing your district.