Sound Transit is riding high with incredibly healthy ridership growth for 2016, buoyed in large part to the opening of three new light rail stations in Seattle and one in SeaTac. Annual boardings rose by 8.02 million to 42.73 million, up from 34.71 million in 2015. That translates to a 23.1% increase in a one-year timespan. Shining above the rest, Link light rail saw the greatest share of the ridership gains. Boardings increased by 7.59 million on Link trains from 11.53 million in 2015 to 19.12 million in 2016–a whopping 65.8% increase year over year–which was well above the 17.2 million targeted by the 2016 Service Implementation Plan (SIP). Sounder also was a high performer in terms of percentage growth gaining 8.1% over the same time period. An additional 310,753 riders boarded Sounder commuter trains in 2016, which in part was bolstered by a new midday roundtrip.
The strength of Link ridership allowed Seattle to lead the nation with a 4.1% increase in transit ridership. Most other transit agencies saw either meager gains on a percentage basis or saw significant losses in 2016.
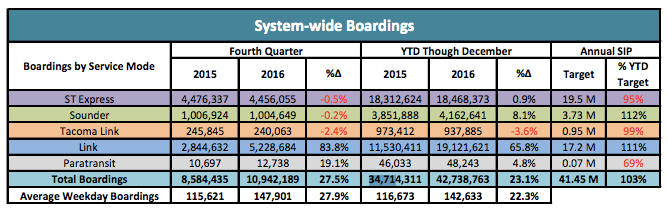
It’s worth pointing out, however, that ST Express, paratransit, and Tacoma Link underperformed the targets set by the 2016 SIP, and Tacoma Link even saw losses in absolute terms.
ST Express Suffers
Sound Transit had hoped to see ridership on the ST Express network to grow from 18.31 million to 19.5 million, but instead only mustered a 0.9% year-over-year increase in growth to 18.46 million rides. In fact, ridership in the fourth quarter of 2016 even saw a small decline (-0.5%) in ridership over the same quarter from the year prior. This was in spite of Sound Transit introducing dozens of new weekday trips and padding schedules on struggling corridors to improve reliability.
One possible reason for the ridership decline could be attributed to new, direct express service added by Community Transit in the fall. On the Seattle-Everett corridor, ST Express Routes 510-513 compete with the 400 and 800 series operated by Community Transit. Looking at the data for the ST Express Routes 510-513 shows that had 636,198 riders in the fourth quarter of 2015 and 620,649 riders in the fourth quarter of 2016–a net decrease of 15,549 riders. So it’s not a big stretch to assume that Community Transit’s new express trips may have poached some riders from their ST Express counterparts. And if true, that still means another 4,733 net rides were lost elsewhere in the network.
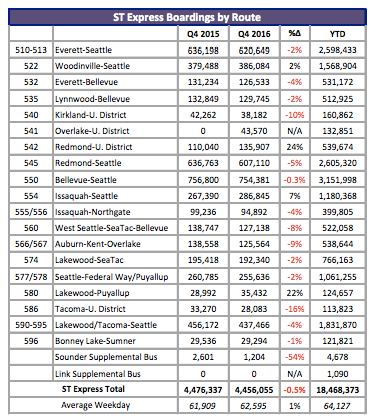
We don’t have to guess where those losses came from. Almost all ST Express routes saw losses year-over-year in the fourth quarter; only Routes 522, 542, 554, and 580 saw gains. The biggest loser in percentage terms–excluding the supplemental Sounder bus–was Route 586 with a 16% decline and the next bigger loser being Route 540 with a 10% decline.
Sound Transit invested 48 new trips on weekdays for Routes 545, 555, 556, 567, 577, 578, and 596 but managed to see ridership in the fourth quarter fall on all of them. In absolute terms, the routes lost more than 57,500 riders. New Route 541 made up for the lion’s share of the losses adding 43,570 riders on its 44 trips each weekday. Route 542, which shares a similar corridor, also saw healthy gains in the fourth quarter garnering 25,867 more rides while getting few if any added trips.
It may be possible that some of these gains came from riders making connecting trips with Link at University of Washington Station. One reason to think that’s the case is that ridership on Route 545 dropped by more than 29,600 riders in the fourth quarter–in line with previous quarters since Route 541 was introduced. But the overall ridership loses aren’t explained by new trips and service supplanting existing ones. Ridership declines in the southend and on the Eastside were generally the most acute, suggesting that other forces are at play with the downward trend.
Beyond the route-level challenges with ST Express, the knock-on effects for the network were felt in other ways:
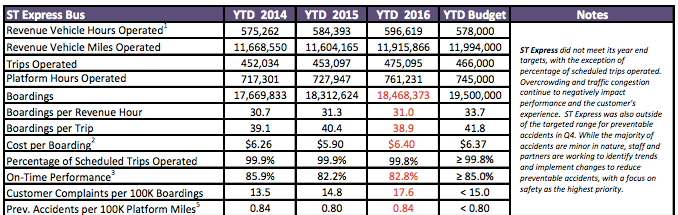
- Boardings per revenue hour dropped from 31.3 to 31.0–well below the 33.7 targeted in the 2016 SIP;
- Boardings per trip dropped from 40.4 to 38.9–again, well below the 41.8 targeted in the 2016 SIP;
- Cost per boarding sharply rose from $5.90 to $6.40;
- Customer complaints sharply rose; and
- Collisions modestly increased.
But on the positive side of things, on-time performance rose and the number of scheduled trips targeted were met.
Link Rides High
Link was already on an upward trajectory for growth coming into 2016, but the opening of light rail stations in Capitol Hill, University of Washington, and Angle Lake sent ridership figures soaring. Light rail closed the year with 65.8% year-over-year gains, but the numbers are even more impressive when looking at the time periods after the new station openings. Between the March opening of the University Link and the end of the year, weekday light rail ridership spiked 78.8% over the same period from the year prior. Fourth quarter weekday ridership rocketed even higher with 83.8% year-over-year gains following the opening of the Angle Lake Station.
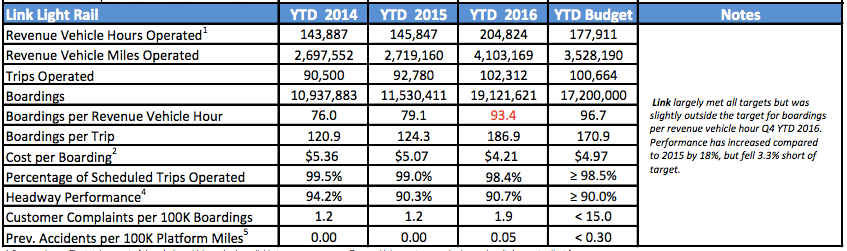
For the most part, Link performed well in meeting and exceeding its targets for 2016. Cost of boardings dropped significantly, boardings per went up, headway performance improved, and total boardings exploded above the modest 17.2 million target. About the only noticeable issues were collisions and falling short of boarding per revenue hour, the latter of which did perform better year-over-year but less than anticipated. Boardings per revenue vehicle hour were also just below the target of 96.7, coming in at 93.4 but up from the year prior when they were averaging 79.1. Indeed, that’s no small jump, but Link likely fell short of the target due to the unplanned introduction of three-car trainsets to regular service.
Year-over-year growth of Link stations was also quite impressive:
| Station | Ridership | Growth |
|---|---|---|
| Westlake | 10,200 | 37.8% |
| University Street | 5,100 | 88.9% |
| Pioneer Square | 3,900 | 85.7% |
| International District-Chinatown | 5,300 | 65.6% |
| Stadium | 1,100 | 37.5% |
| SODO | 2,000 | 53.8% |
| Beacon Hill | 2,700 | 35% |
| Mount Baker | 2,300 | 15% |
| Columbia City | 2,400 | 33.3% |
| Othello | 2,400 | 26.3% |
| Rainier Beach | 1,900 | 26.7% |
| Tukwila/International Boulevard | 2,700 | No change |
| SeaTac/Airport | 5,200 | 10.3% |
Some of the growth was natural, but much of it was driven by the opening of new stations. This is especially clear with rapid growth in Downtown Seattle. Other portions of the network also saw rapid ridership gains like Columbia City, Beacon Hill, Othello, and Rainier Beach, which is perhaps an indication that the ability to access stations further north–and even south–has increased the utility of light rail for longer-distance trips. It’s interesting to note, however, that Westlake Station didn’t experience the same degree of ridership gains–at least not in percentage terms–as the other three core Downtown stations. That may be an indication that buses to Downtown from places like Capitol Hill are still preferable over hoofing it to a train.
Zooming in on the fourth quarter numbers, Sound Transit says average weekday ridership stood at 66,203 boardings in 2016 versus 34,963 in 2015. Again, much of that was driven by the three new light rail stations that, when combined, averaged 18,900 daily riders on weekdays. Coming out on top in pack, University of Washington Station clocked in with 9,300 daily boardings, followed by Capitol Hill Station with 6,800 daily boardings and Angle Lake Station with 2,800 daily boardings.
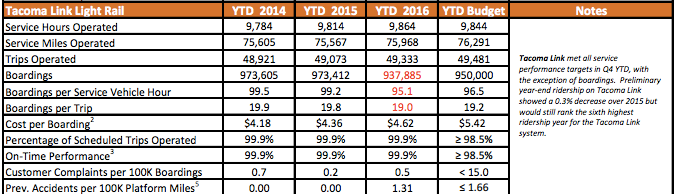
Tacoma Link Purges
Tacoma Link struggle with ridership in 2016. Sound Transit had expected a decline over 2015, but the service fell more than 12,000 riders below the agency’s target. For the full year, the line saw a 3.6% ridership decline. That was more severe than fourth quarter performance, which was less significant with a 2.4% ridership decrease over the same timeframe in 2015. Sound Transit points to overall transit losses in Pierce County where ridership has been declining on Pierce Transit routes. The same phenomenon has been occurring on many Sound Transit routes operated to and from Pierce County.
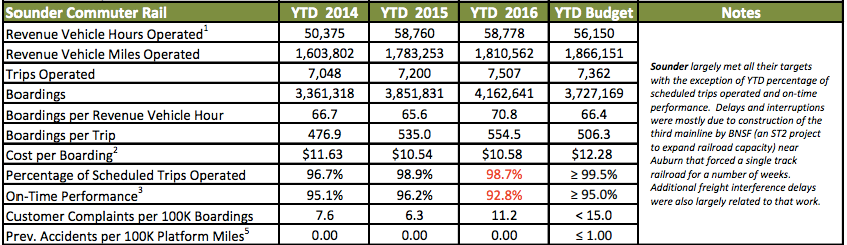
Sounder Shines
Sounder continues its impressive growth. Smashing expectations for 3.73 million rides, Sounder grew to 4.16 million riders in 2016–an 8.1% increase year-over-year. Much of this growth can be attributed to new ridership on the South line, due in part to the introduction of a new off-peak roundtrip service on that corridor. Ridership on the North line was far less impressive remaining largely flat. In fact, that line only added about 100 more rides in the fourth quarter of 2016 for its standard commuter service. Sounder generally met its targeted goals, but did experience some challenges with on-time performance. Sound Transit reports that there had been delays and service disruptions because of track construction near Auburn–which will add an extra track for local relief.
National Trends: Cheap Gas and Uber
Transit ridership nation-wide has suffered this year. Some have suggested low gas prices are to blame since cheap gas make driving alone or carpooling more economically competitive. That’s likely a big part of ridership losses. Another factor at play: app-based taxi companies like Uber and Lyft are likely skimming riders by offering super-low fares subsidized by venture capital cash.
These taxi companies can offer greater convenience but they’re hardly a scalable solution for cities: Uber and Lyft’s popularity leads to worsening traffic, decreasing not only the quality of the service they themselves provide, but also potentially dragging down the quality of bus service, too. Transportation analyst Brian Schaller advanced this case in a recent report that showed Uber and Lyft had a big impact on New York City traffic: “As a result of growing trip volumes, TNCs added 600 million miles of driving to city streets in 2016.” (You can read Streetsblog’s cliffnotes version of Schaller’s report here.)
Instead, cities should focus on solutions that can scale–which is why Seattle’s big investment in light rail is wise–but too often upgrading buses to fuller bus rapid transit standards, which allows them to attract and handle more riders, falls by the wayside. Because American cities are rarely willing to dedicate lanes and prioritize buses through intersections, it would appear American transit riders are all too ready to choose another mode should the option present itself. Hence cheap gas and cheap Uber and Lyft fares are likely to pilfer riders until we prioritize transit and stop letting our major bus lines languish in traffic or suffer overcrowding.
Sound Transit Will Unleash More Regional Service in 2016