Bigger buildings and thousands of new residents and jobs could be headed to Uptown in the coming years, depending on the outcome of an urban design framework moving into its final stages. The Office of Planning and Community Development (OPCD) released a Final Environmental Impact Statement (EIS) last week to evaluate different scenarios for growth in the neighborhood. Three approaches to land use changes were identified, including one that was preferred. Another alternative, which is statutorily required, was a no-change status quo approach. Under full buildout of the Preferred Alternative, an extra 3,122 households, 4,245 residents, and 230 jobs would be accommodated in Uptown over the No Action Alternative. And over the next 20 years, the Preferred Alternative would add an extra 370 households, 503 residents, and 300 jobs over doing nothing.
The Final EIS considered a variety of impacts resulting from changes in land use, such as urban design and view corridors, displacement effects, and transportation. It also highlights important background information, such as redevelopable land and demographic data from which the Final EIS bases its analysis. OPCD is recommending specific zoning changes and investments to adequately mitigate impacts associated with increasing development capacity.
Land Use Pattern
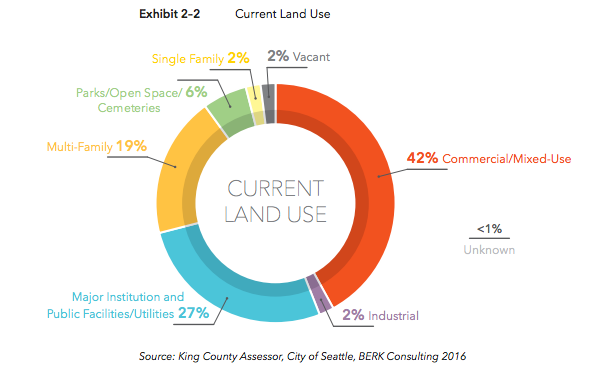
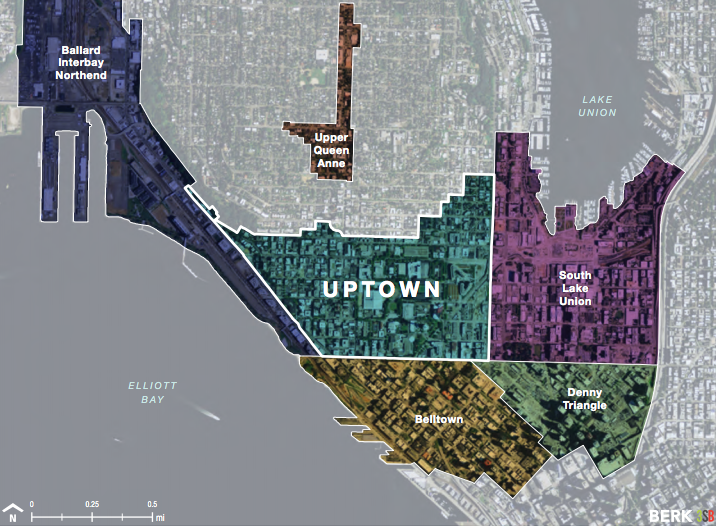
The prevailing land use pattern in Uptown consists of commercial and mixed-use, multi-family residential, and public and institutional uses. Zoning across the neighborhood is largely reflective of this with much of the area around Seattle Center zoned with Neighborhood Commercial (NC) and Seattle Mixed (SM), which are mixed-use districts. Multi-family residential zones are reflected in the Lowrise 2 and 3 (LR2 and LR3) and Midrise (MR) zoning. And the Commercial 1 and 2 (C1 and C2) zones hem in the far ends of the neighborhood with general commercial uses.
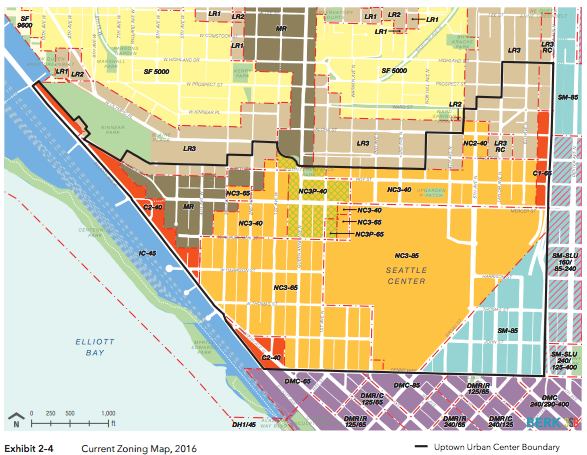
Beyond these areas, zoning flows from mid- and high-rise mixed-use (to the south and east) and industrial districts (to the west) to low-rise multi-family and single-family residential districts (to the north).
Rezone Alternatives
The Uptown FEIS considered four broad alternatives: No Action, Mid-Rise, High-Rise, and Preferred.
- Alternative 1: This is the No Action alternative, which would retain existing zoning and development regulations.
- Alternative 2: This is the Mid-Rise alternative, which would result in moderate increases in height and floor area allowances paired with revised design regulations and mandatory affordable housing requirements.
- Alternative 3: This is the High-Rise alternative, which would result in significant increases in height and floor area allowances paired with revised design regulations and mandatory affordable housing requirements.
- Preferred Alternative: This alternative is a mix of Alternatives 2 and 3, which would result in a mix of modest and significant increases in height and floor area allowances paired with revised design regulations and mandatory affordable housing requirements.
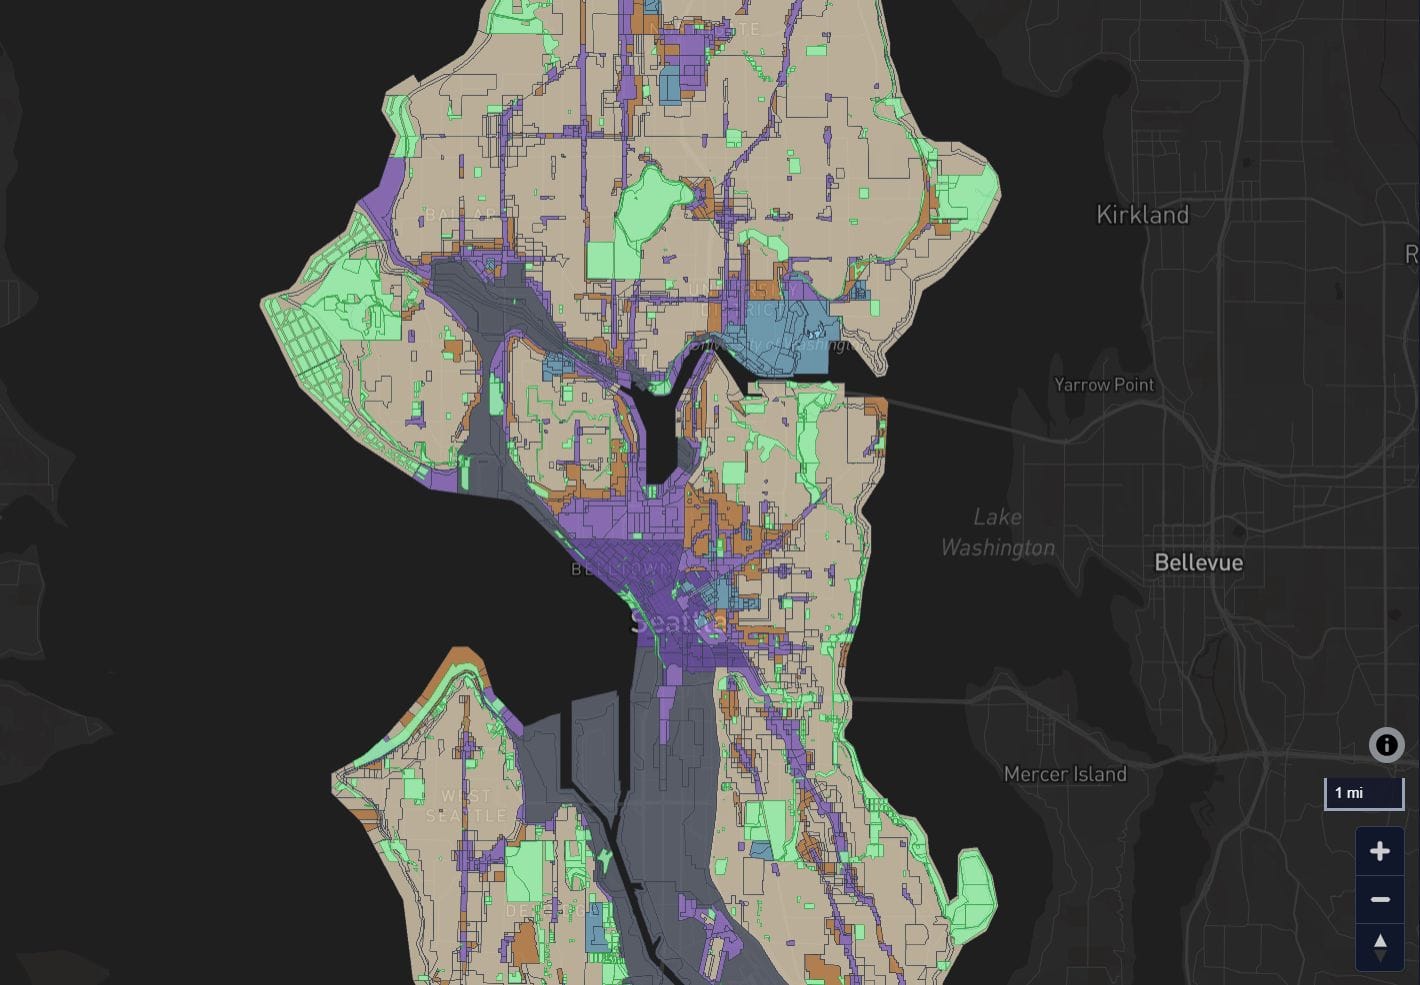
Alternatives 1, 2 and 3 were considered earlier in the EIS process with the Draft EIS analyzing a variety of development capacity increases, which are represented in the map below with a range of maximum heights:
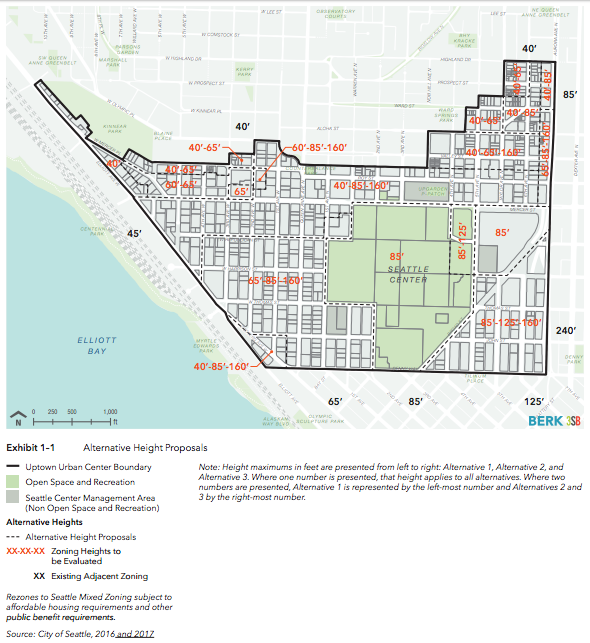
The Preferred Alternative translates the heights considered in Alternatives 2 and 3, generally mixing them in different ways. Broadly speaking, the height limits proposed in the Preferred Alternative are more modest in scale north and west of Seattle Center than those identified in Alternative 3, approximating height limit ranges evaluated under Alternative 2. However, the proposed height limits in the Preferred Alternative on the blocks in SM triangle near Aurora Ave N and Denny Way are substantially more in line with Alternative 3.
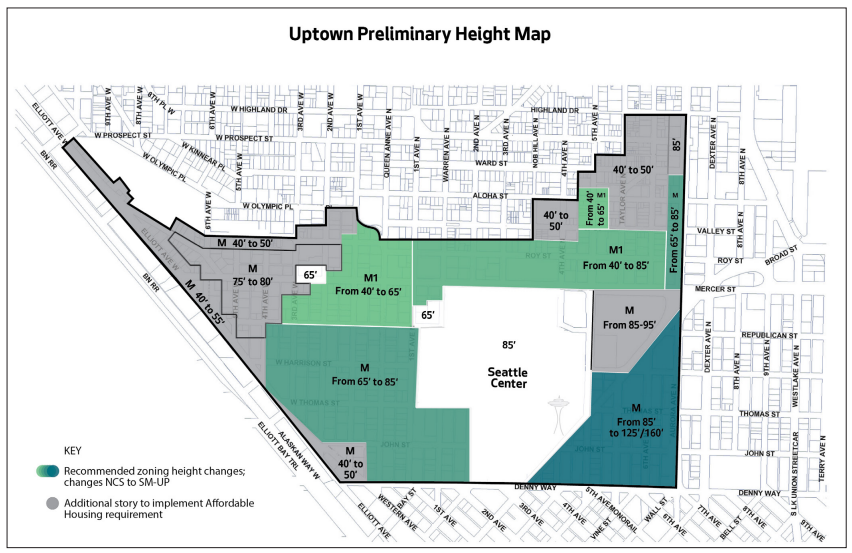
To provide a little more specificity, here’s various pockets of the proposed changes would shake out:
- Within the northwest and northeast portions of Uptown, height limits would be increased one to two floors allowing mandatory housing affordability requirements to be unlocked;
- Another small area at the junction of Denny Way and Elliot Avenue would see height limits increase by one floor;
- In areas along Mercer Street and Roy Street as well as 5th Ave N and Aurora Ave N north of Seattle Center, height limit increases would resemble those modeled under Alternative 2;
- A large area west of Seattle Center would also get broad height increases similar to Alternative 2; and
- A significant number of block in the northwest and northeast of Uptown near Queen Anne Hill, however, would get height limits less than modeled under Alternatives 2 and 3.
In three other cases, the Preferred Alternative would diverge from the Draft EIS models of Alternatives 2 and 3, providing extra height:
- The pocket of C2 zoning north of Mercer Street would be raised from 40 feet to 50 feet, which was originally modeled as 40 feet;
- The MR zone would be raised to 80 feet, which is higher in some blocks than originally modeled; and
- The Gates Foundation properties would receive SM zoning similar to that in the area just south with a height increase to 95 feet, an increase of 10 feet and more than modeled in the Draft EIS.
The latter three zoning proposals in the Preferred Alternative are easily picked up in the map below, which also depicts commonalities and other differences with the action alternatives in the Draft EIS:
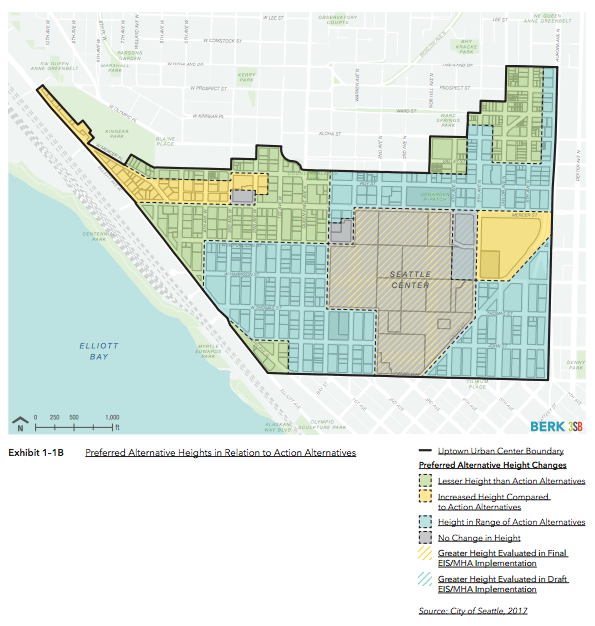
On additional area worth highlighting is Seattle Center, which isn’t identified as a location for zoning changes in Preferred Alternative. On this issue, the Final EIS states that:
…[H]eights on the Seattle Center campus as well as the abutting KCTS site and SPS stadium parking site are retained at 85 feet in height. However, the EIS studies additional heights for these public properties in order to treat the sites similar to privately held sites and to consistently consider the potential application of the MHA program. Given there are no specific development proposals at this time for the public properties, retaining current heights is part of the Preferred Alternative at this time. Heights may be increased in the future through the MHA program or through contract rezones.
Projected Household, Population, and Jobs Changes
Underpinning the EIS analysis is projected household, population, and jobs changes that could occur under each alternative. There are approximately 6,900 households, 9,300 residents, and 14,600 jobs in Uptown currently, but under all four alternatives these numbers are projected to grow. If the City does nothing to zoning, there will be 3,000 more households, 4,080 more residents, and 2,500 jobs by 2035. At full buildout, the number of net new households, residents, and jobs would be at least double that. The three action alternatives each accommodate more growth than doing nothing, which is born out in the table below.
Uptown Alternatives: Households, Population, and Jobs
| Current | No Action | Mid-Rise | High-Rise | Preferred Alternative | |||||
|---|---|---|---|---|---|---|---|---|---|
| Net Growth Estimate | Net Full Buildout Capacity | Net Growth Estimate Scenario | Net Full Buildout Capacity | Net Growth Estimate Scenario | Net Full Buildout Capacity | Net Growth Estimate Scenario | Net Full Buildout Capacity |
||
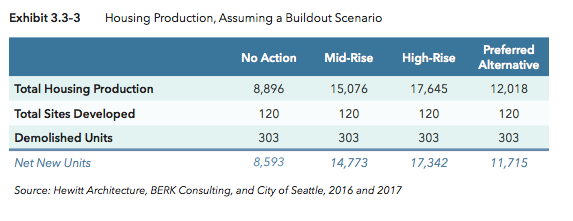
| Households | 6,855 | 3,000 | 8,593 | 3,370 | 14,773 | 3,745 | 17,342 | 3,370 | 11,715 |
| Population | 9,323 | 4,080 | 11,687 | 4,583 | 20,092 | 5,093 | 23,586 | 4,583 | 15,932 |
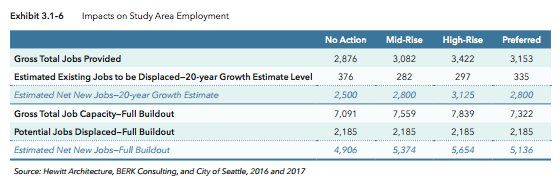
| Jobs | 14,592 | 2,500 | 4,906 | 2,800 | 5,374 | 3,125 | 5,654 | 2,800 | 5,136 |
This table compares current and future household, population, and job scenarios under different alternatives. The "growth estimate" time period is 2015 to 2035.
What’s particularly notable in table is the full buildout relationship between the Preferred Alternative and the other action alternatives. Across the board, the Preferred Alternative would have less development capacity in absolute terms. The primary driver for this seems to be the fact that significant portions of Uptown are proposed for less capacity increases than those analyzed in Alternatives 2 and 3. Still, the Preferred Alternative buildout scenario would achieve a substantially higher net new housing and population numbers over the No Action Alternative. In terms of accommodating new growth through 2035, the Preferred Alternative would be similar to both Alternatives 2 and 3, though more closely mimicking Alternative 2.
Developable Sites
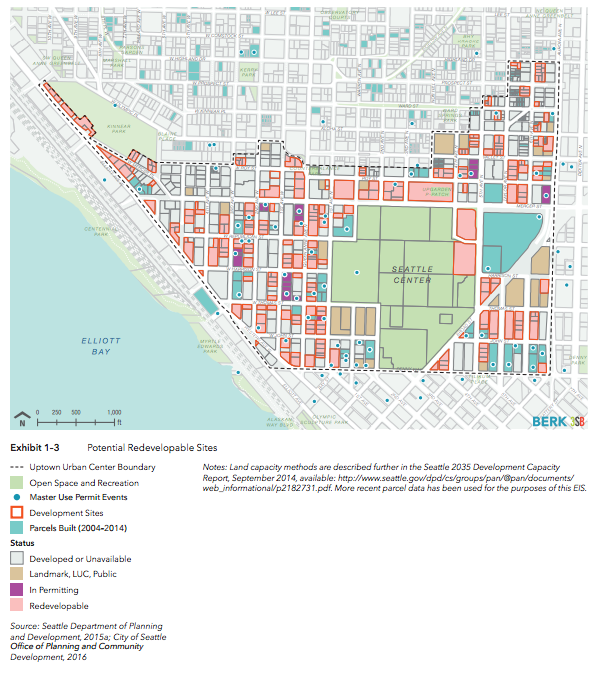
In analyzing alternatives, the EIS considered the amount of land that could be redeveloped over the planning horizon. Dozen of blocks are likely candidates for redevelopment, including almost the whole set of blocks facing Mercer Street between 4th Ave N and 2nd Ave W. Aside for a few blocks north and west of Mercer Street and 2nd Ave W, most blocks have at least one or more sites are that are redevelopable.
These sites exhibit one or more of the following characteristics: existing buildings are [less than or equal] 25 percent of what current zoning allows, buildings are relatively lower value compared to property values, and parking lots. Other factors that would influence redevelopment are property owner preferences, real estate market conditions, and development regulations. All alternatives, particularly Alternatives 2 and 3 with increased heights, support redevelopment of the Northeast Quadrant of the Seattle Center, promoting greater opportunities within the Theater District for affordable housing and mixed use commercial development, including at the following sites:
– Mercer Arena—future home of Seattle Opera
– KCTS site
– Memorial Stadium
– Mercer Garage
– Mercer Street Block—potential affordable housing
The map also takes into account properties that aren’t considered developable, such as sites already in the permitting pipeline, designated as a historic landmark or public property, recently developed, or otherwise not likely to redeveloped during the analyzed planning horizon.
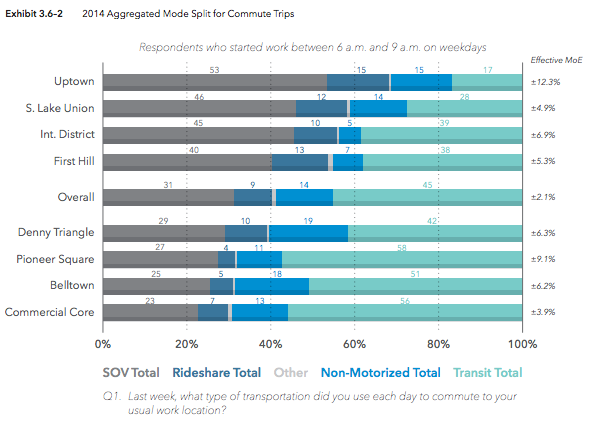
Transportation Projections and Solutions
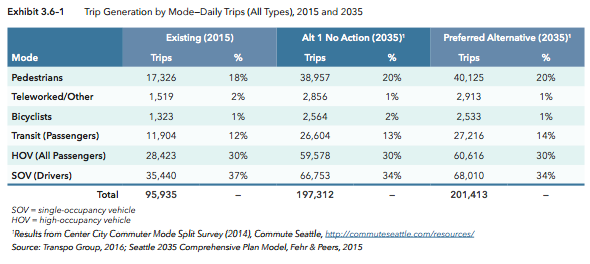
The transportation mode share within the Uptown urban center is heavily weighted to private automobile trips during weekday commuting hours compared to other urban centers nearby. Single occupancy vehicle trips make up 53% of all trips during the weekday morning peak. Compare that to neighboring South Lake Union which stands at 46% SOV trips and Belltown at 25% SOV trips. However, there is a hefty portion of commuters that walk, bike, or take transit, which totals 32% of all trips.
The general modal split is less SOV-centric when considering the full daily average of trips; SOV trips constituted 37% of all daily trips in 2015. The EIS compared also how the modal split might change under the No Action and Preferred Alternatives. Modest changes were projected with SOV trips falling 34% in both the No Action and Preferred Alternatives. Transit and walking trips would see very modest increases in trip shares under both scenarios with bicycling and teleworking being mixed but minor in change.
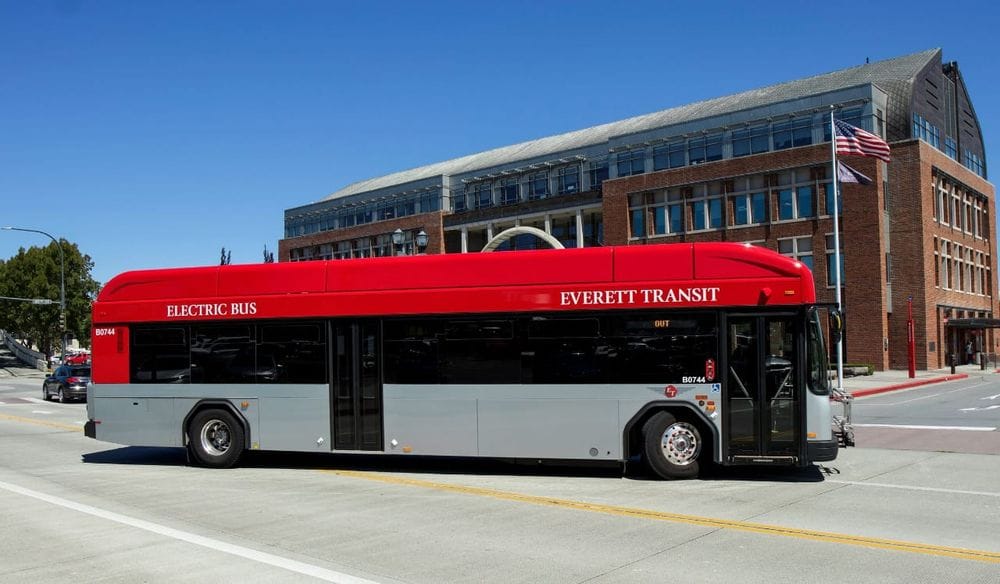
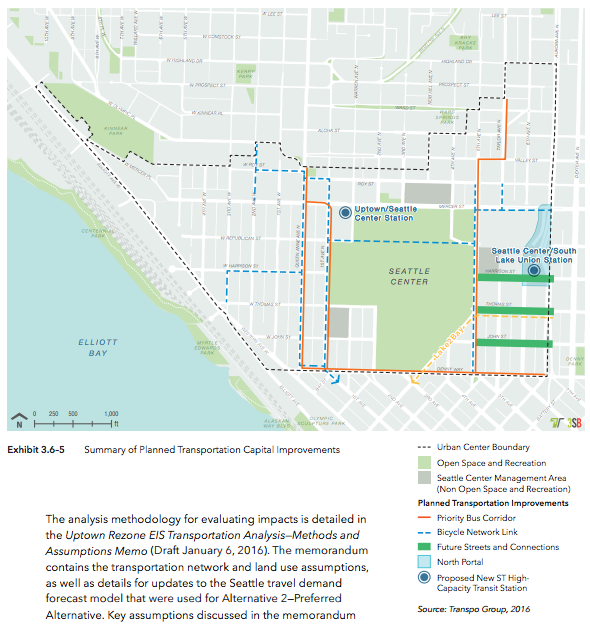
To compensate for growing transportation demands, the Final EIS identifies a variety of strategies to accommodate more housing, residents, and jobs. The outlined strategies, include:
- Rolling out high priority bus corridors identified in the Seattle Transit Master Plan;
- Locating new light rail stations as part of Sound Transit 3;
- Implementing the Bicycle Master Plan;
- Repairing the grid along Aurora Ave N by reconnecting east-west streets; and
- Making mobility improvements as part of the Lake 2 Bay plan.
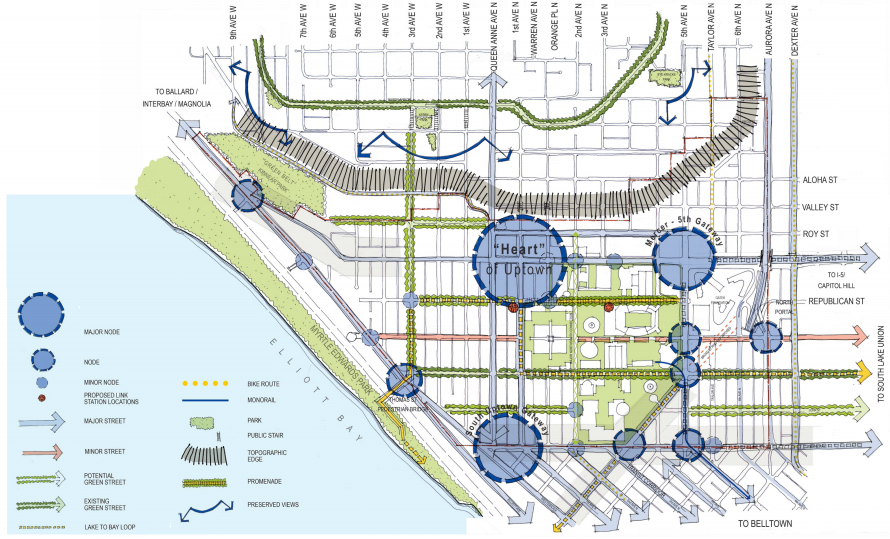
Beyond the planned improvements already programmed for delivery over the 20 years, the Uptown Urban Design Framework also identified other transportation priorities for the neighborhood. These specifically include:
- Locating the light rail station around 1st Ave N and Republican Street;
- Developing Republican Street as a festival street between Queen Anne Ave N and Seattle Center;
- Creating a bike corridor from the festival street to the Thomas Street Bridge on Republican Street;
- Eliminating the one-way couplet in operation on Queen Anne Ave N and 1st Ave N;
- Transforming Broad Street into a Green Street; and
- Implementing a pedestrian street design that extends from Elliot Ave W to Eastlake Ave E via Thomas Street and Seattle Center.
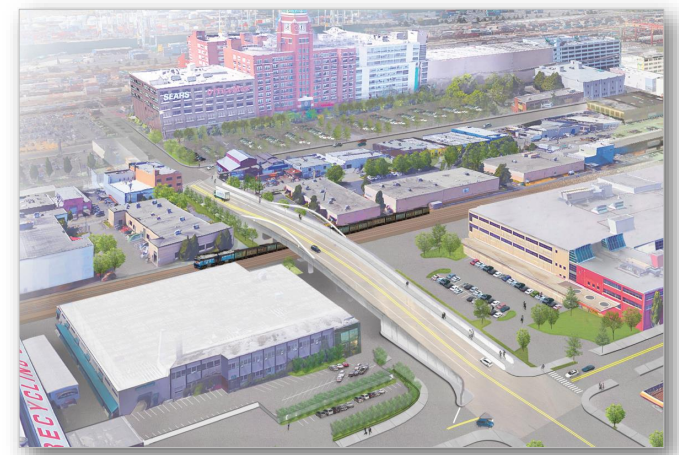
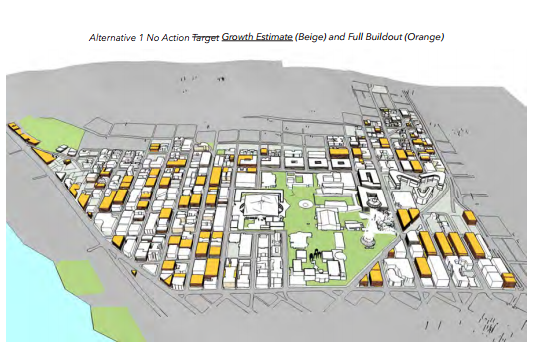
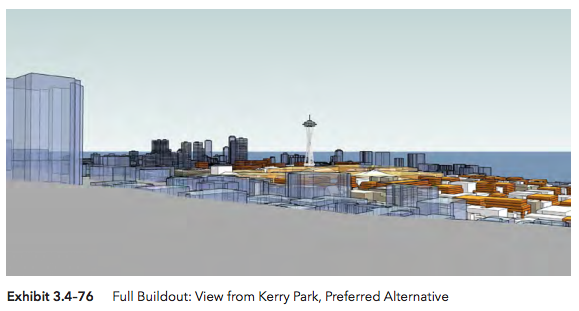
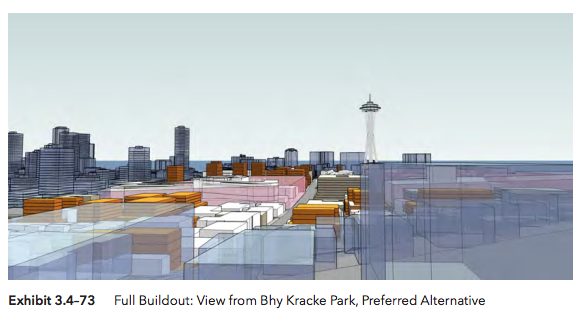
Renderings of Full Buildout of Preferred Alternative
The EIS provides a window into what redevelopment of the Uptown area might look like under different scenarios. Renderings consider the differences in bulk and scale at street level and from above. Take Alternative 1 (the No Action Alternative) versus the Preferred Alternative. The bulk and scale as viewed from above is mostly only distinguishable on blocks where the highest density increases would be added–the blocks southeast of Broad Street.
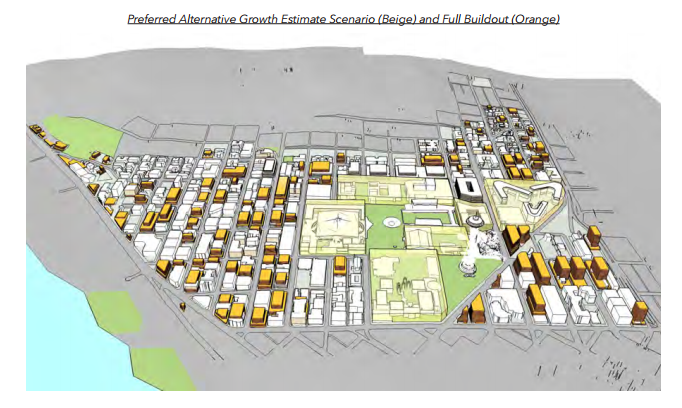
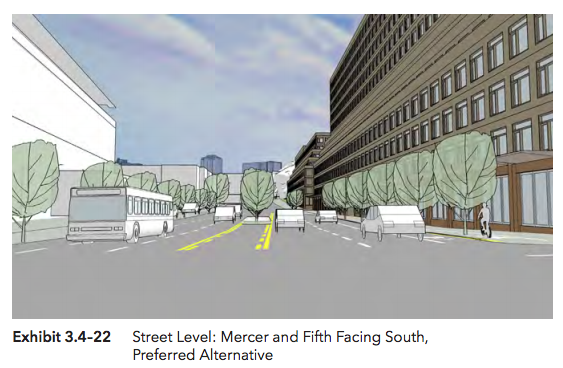
The renderings also show how bulk and scale might differ from the street level. Two images below illustrate what type of forms might be seen at full buildout.
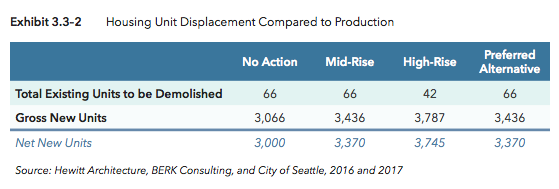
Displacement and Affordability
The Final EIS provided information on displacement impacts and solutions to bring guaranteed affordable housing to Uptown. Under the four alternatives, no more than 66 dwelling units are likely to be displaced by development as well as a further 335 jobs over the next 20 years. The No Action Alternative would likely have the greatest aggregate displacement effects with the Preferred Alternative close behind. With a longer-term lens to full buildout, all four alternatives would result in the same number of dwelling units and jobs being displaced because the alternatives assume redevelopment of the same sites.
One important thing to note, however, is that the Final EIS analysis does not identify more specific information about the dwelling units that could be displaced, such as: the number of individuals projected to be impacted, the quality and tenancy of the housing, and income and affordability levels associated the impacted residents and units. The same is true for business and employees impacted by displacement. Nevertheless, the Final EIS analyzes potential mitigation measures that could compensate for the loss of affordable housing units.
Examples of mitigation measures to avoid negative economic impacts to residents include things like the City’s:
- Homebuyer Program;
- Rental Assistance Program;
- Multi-Family Tax Exemption Program (MFTE);
- Incentive Zoning; and
- Other affordable housing strategies.
The MFTE Program could be one way of developing a significant segment of medium-term affordable housing:
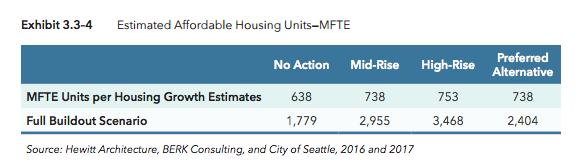
Under the Preferred Alternative, 738 dwelling units could be developed as rent-restricted affordable units over the next 20 years with a total of 2,404 such units entering the program through full buildout. New development, however, is restricted to 14 years in which dwelling units can participate in the MFTE program and property owners can always choose leave exit the program early. During the 20-year planning period, there is of course uncertainty in how state law could be changed with regard to authorizing local programs like the MFTE. The law could be changed to extend the period in which properties can participate in an MFTE program or be entirely eliminated, which are things beyond the scope of the EIS analysis to heavily consider.
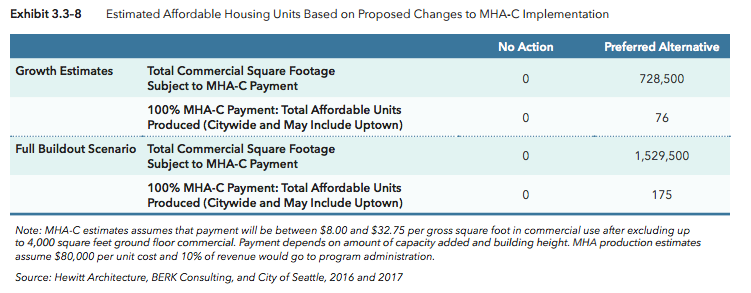
Separately, the Final EIS assumes that new development would participate in the City’s growing Mandatory Housing Affordability (MHA) program. Commercial development is projected to result in 76 rent- and income-restricted units in Preferred Alternative during the next 20 years and 175 such unit at full buildout. The No Action Alternative, however, would deliver zero rent- and income-restricted units as part of new commercial development.
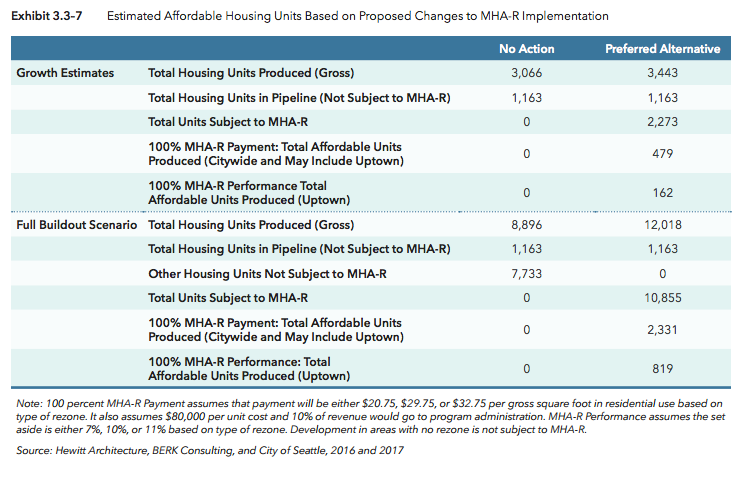
Residential development would offer a lot more guaranteed affordable housing with 162 rent- and income-restricted units built on-site in Uptown developments and a further 479 rent- and income-restricted units built through in-lieu payment fees to the City over the next 20 years. The numbers anticipated at full buildout are leaps and bounds higher with 819 rent- and income-restricted units built on-site in Uptown developments and another 2,331 rent- and income-restricted units built through in-lieu payment fees. The Final EIS estimates that 717 rent- and income-restricted MHA units could be delivered in the next 20 years, which represents a significant share of the gross increase in new housing units poised to be constructed in Uptown.
OPCD plans to hold an open house on the Final EIS tonight (Wednesday, March 29th) at the Seattle Center Pavilion from 5pm to 7pm. Public comment on the Final EIS is open through April 22nd and appeals are due by April 6th.
Uptown FEIS by The Urbanist on Scribd