Density is a controversial subject in virtually all American communities. While some districts and communities are seeking more density to promote economic revitalization and a host of other progressive goals, density is more often a thing to be feared. Many think that density is simply ugly: more and bigger buildings, more asphalt and concrete, fewer trees and green space, less sunlight and privacy, and even less air to breath.
But with a finite amount of land to house us, communities all around the globe have come to understand the need and benefits of density (saving land and energy use, for starters). Here in Washington State, the Growth Management Act dictates that cities plan for anticipated growth, which, in many cases, means more density in areas with the infrastructure to support it.
Zoning codes all regulate density in some form. Single-family districts include lot size minimums. Multifamily districts often include a maximum number of dwelling units allowed per acre. Major political battles often erupt when density increases are proposed. Community members may fight against a proposed density number, but often they don’t know what it looks like.
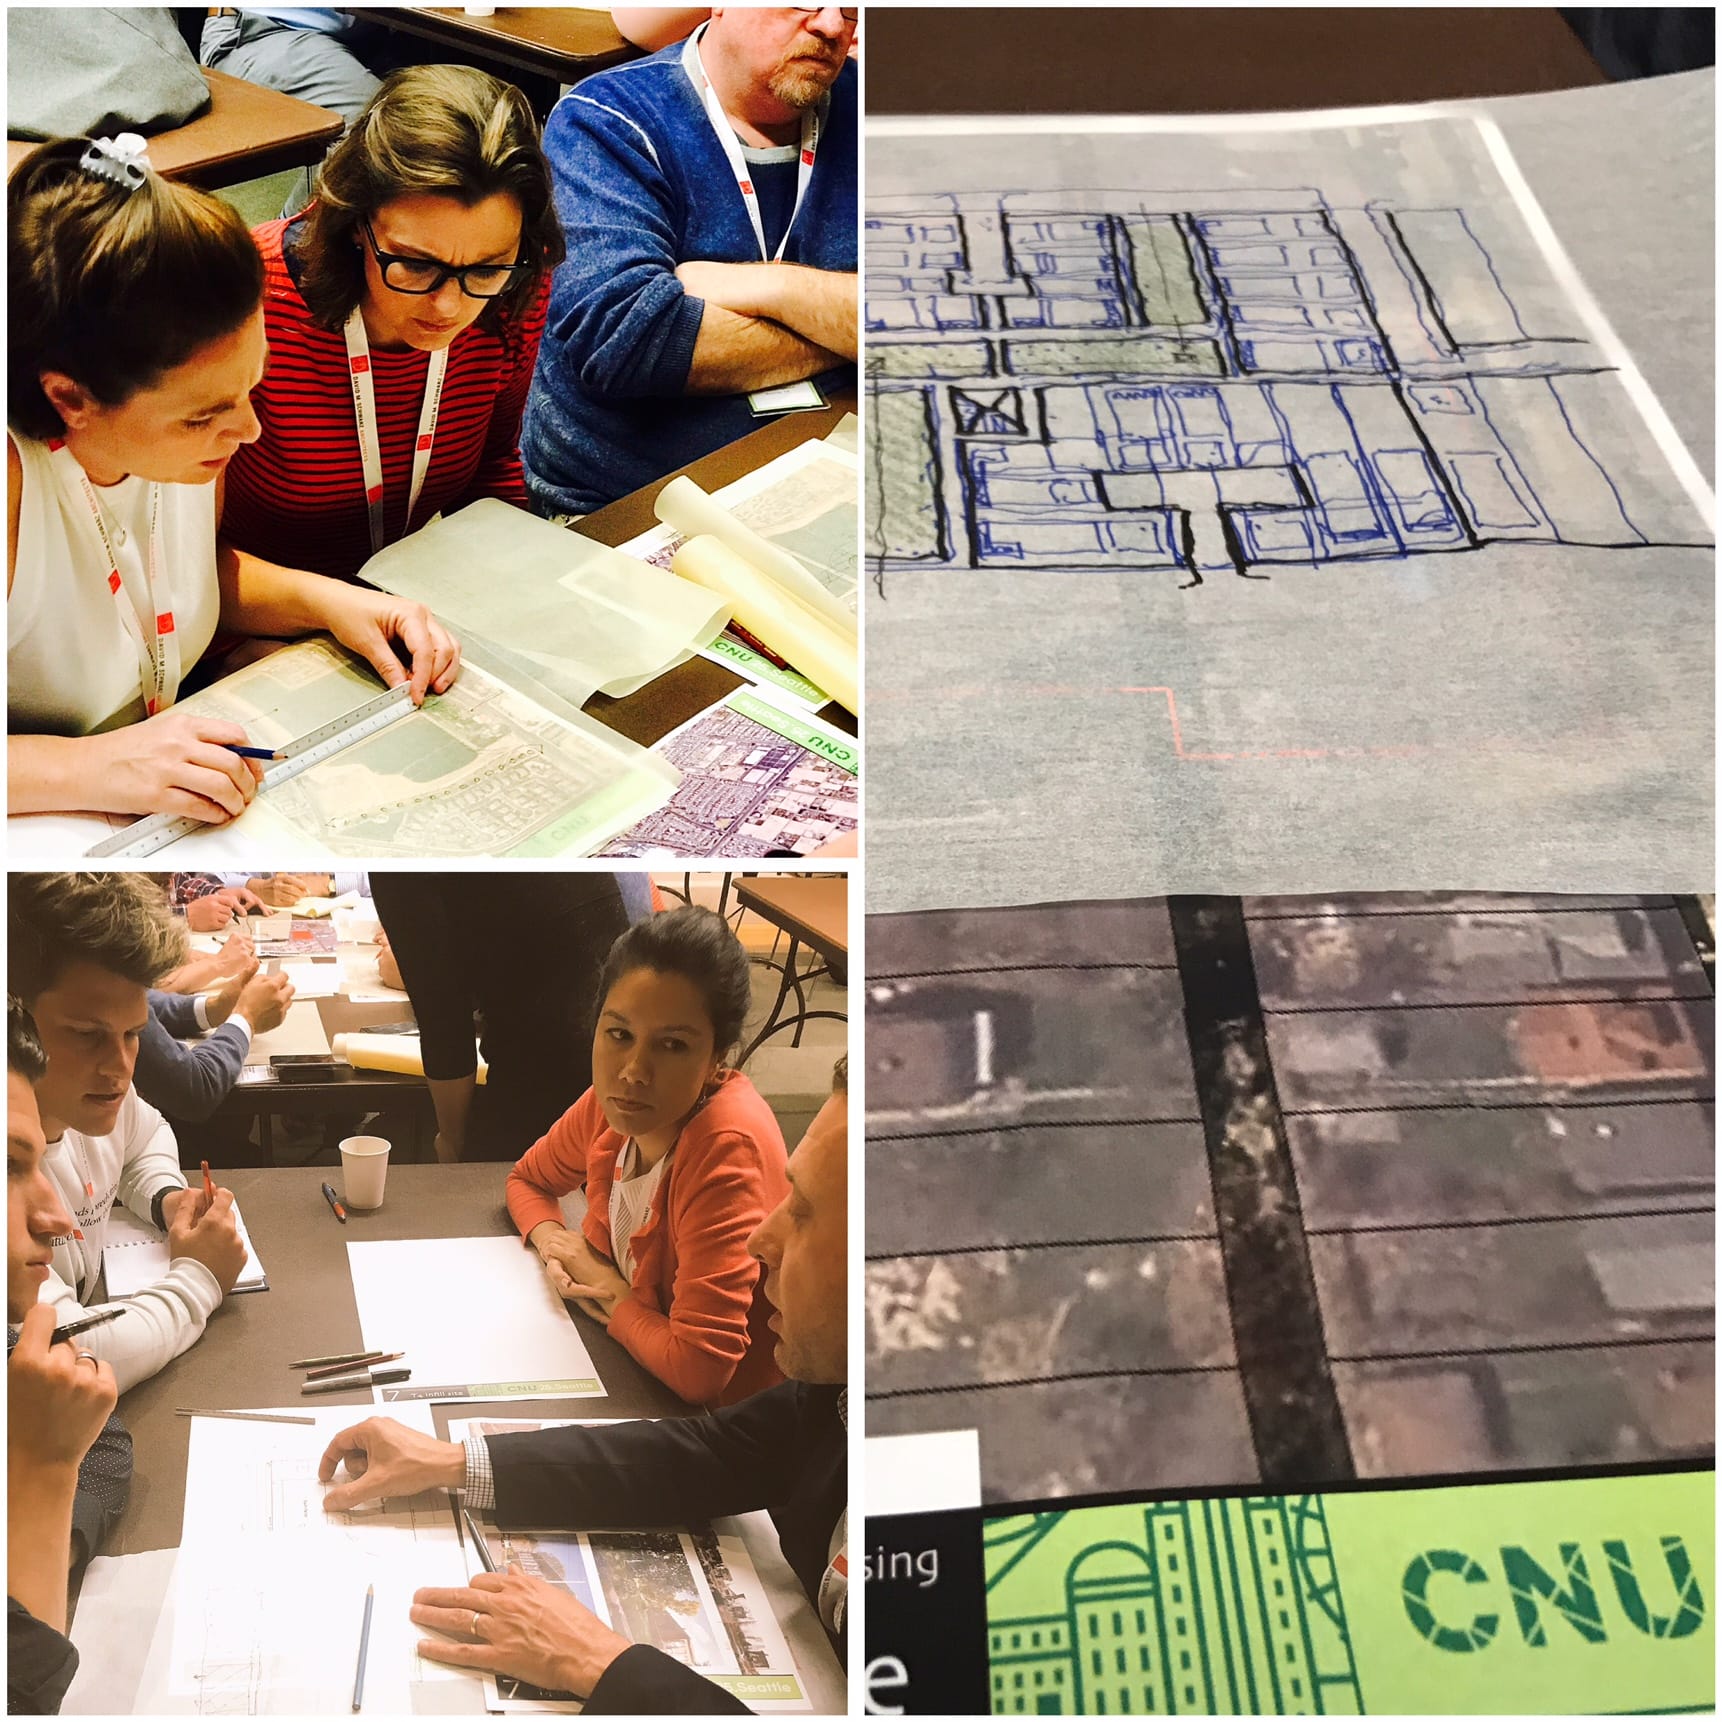
Over the past few years, I’ve conducted a slideshow and discussion on density to planning commissions and committees in multiple cities. The major conclusion of the analysis is that perceptions on density depend on design. As author Julie Campoli noted in her 2007 book, Visualizing Density, people tend to overestimate the density of monotonous, amenity-poor developments and underestimate the density of well-designed, attractive projects, thereby reinforcing negative stereotypes.
This article shows examples of various densities in Washington State communities and closes with a summary of design elements that help to make density more compatible.
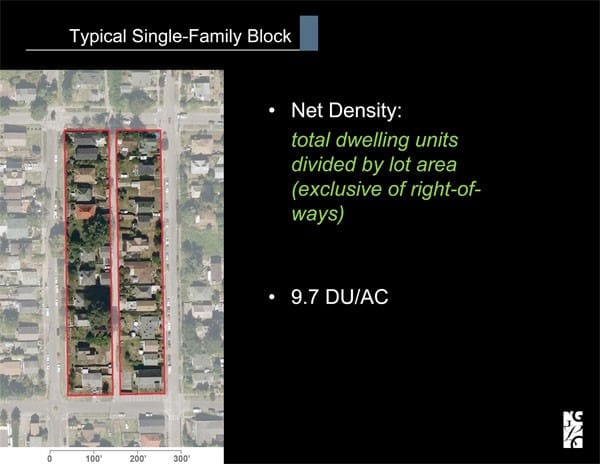
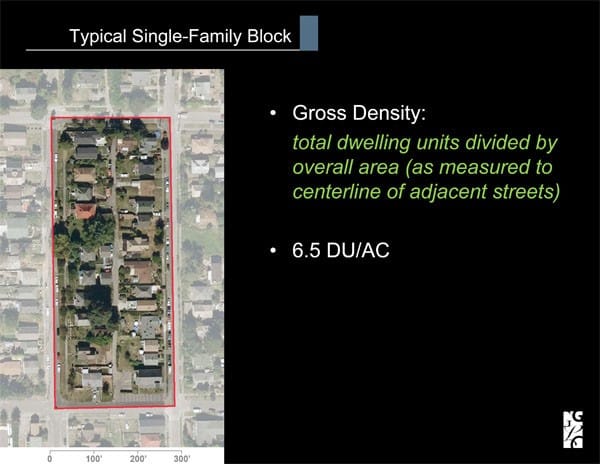
Clarification of Gross Versus Net Density
First, it’s important to clarify how densities are measured. Zoning codes either measure density on a gross or net basis. Net density includes just individual lots in the measurements while gross density includes street rights-of-way and common areas. As a consequence, net density figures are typically 50-70% higher than gross density numbers.
Gross density measurements are often best used when looking at large developments that are likely to have internal roads and open space. Net densities are often more appropriate for neighborhood infill situations. The graphics below, courtesy of GGLO, help to explain the differences.
Density Examples
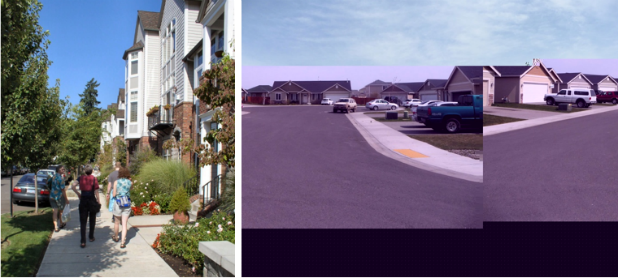
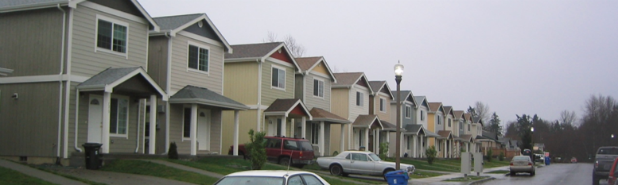
4 Dwelling Units Per Acre (Gross)
Notable features: The lack of street trees combined with a prevalence of garages and driveways. The city’s new standards, however, reduce street widths, include wide planter strips and street trees, and de-emphasize the garage in the design of home fronts.

5.3 Dwelling Units Per Acre (Gross)
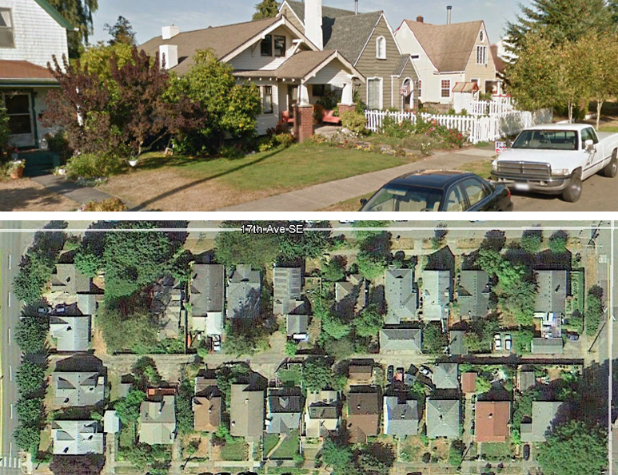
Notable features: Traditional streetscapes with sidewalks, planter strips, street trees, covered entries, and a diversity of architectural styles. Access to garages is provided by an alley behind the single-family houses.
5.9 Dwelling Units Per Acre (Gross)
Notable features: Traditional streetscape with sidewalk, street trees, shallow front setbacks and front porches. The courtyard-access lots behind the street-fronting homes add density, but its density that’s largely screened from the street. Note that the second row of homes at the top and bottom of the image are accessed by private lanes.
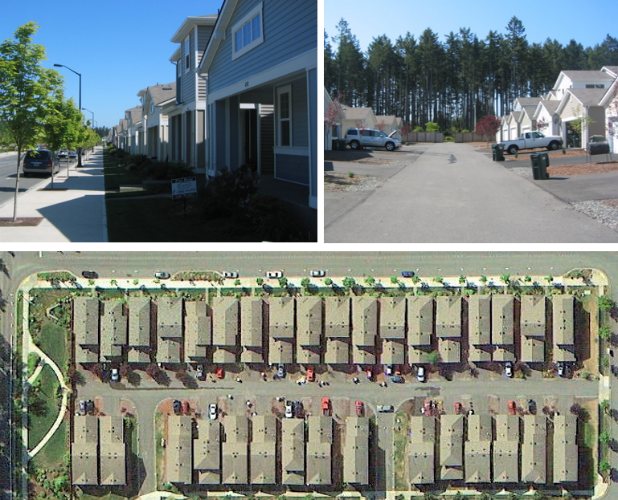
7.7 Dwelling Units Per Acre (Gross)
Notable features: Consistent setbacks, shallow porches, minimal setbacks between homes, and alleys with driveway space in back. The monotonous layout and design, combined with the lack of usable open space for residents, led to updates to Lacey’s zoning and design standards.
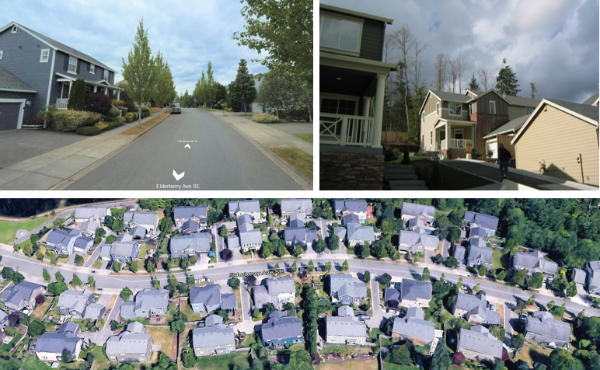
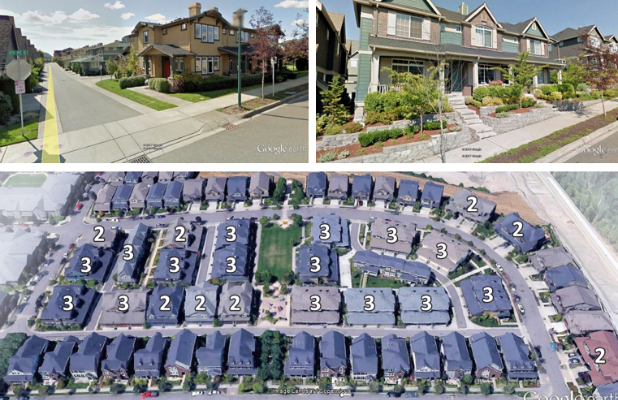
9.3 Dwelling Units Per Acre (Gross)
Notable features: Traditional streetscapes, a combination of front- and alley-loaded dwellings, and strategically located, common open space. The numbers below refer to duplexes (2) and triplexes (3). The remaining structures are single-family homes.
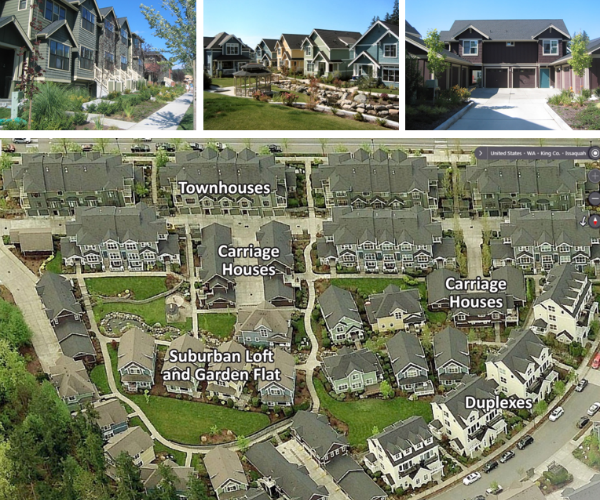
15 Dwelling Units Per Acre (Gross)
Notable features: A variety of housing types, pedestrian-friendly street frontages, alleys and auto courts, and common open space with trails.
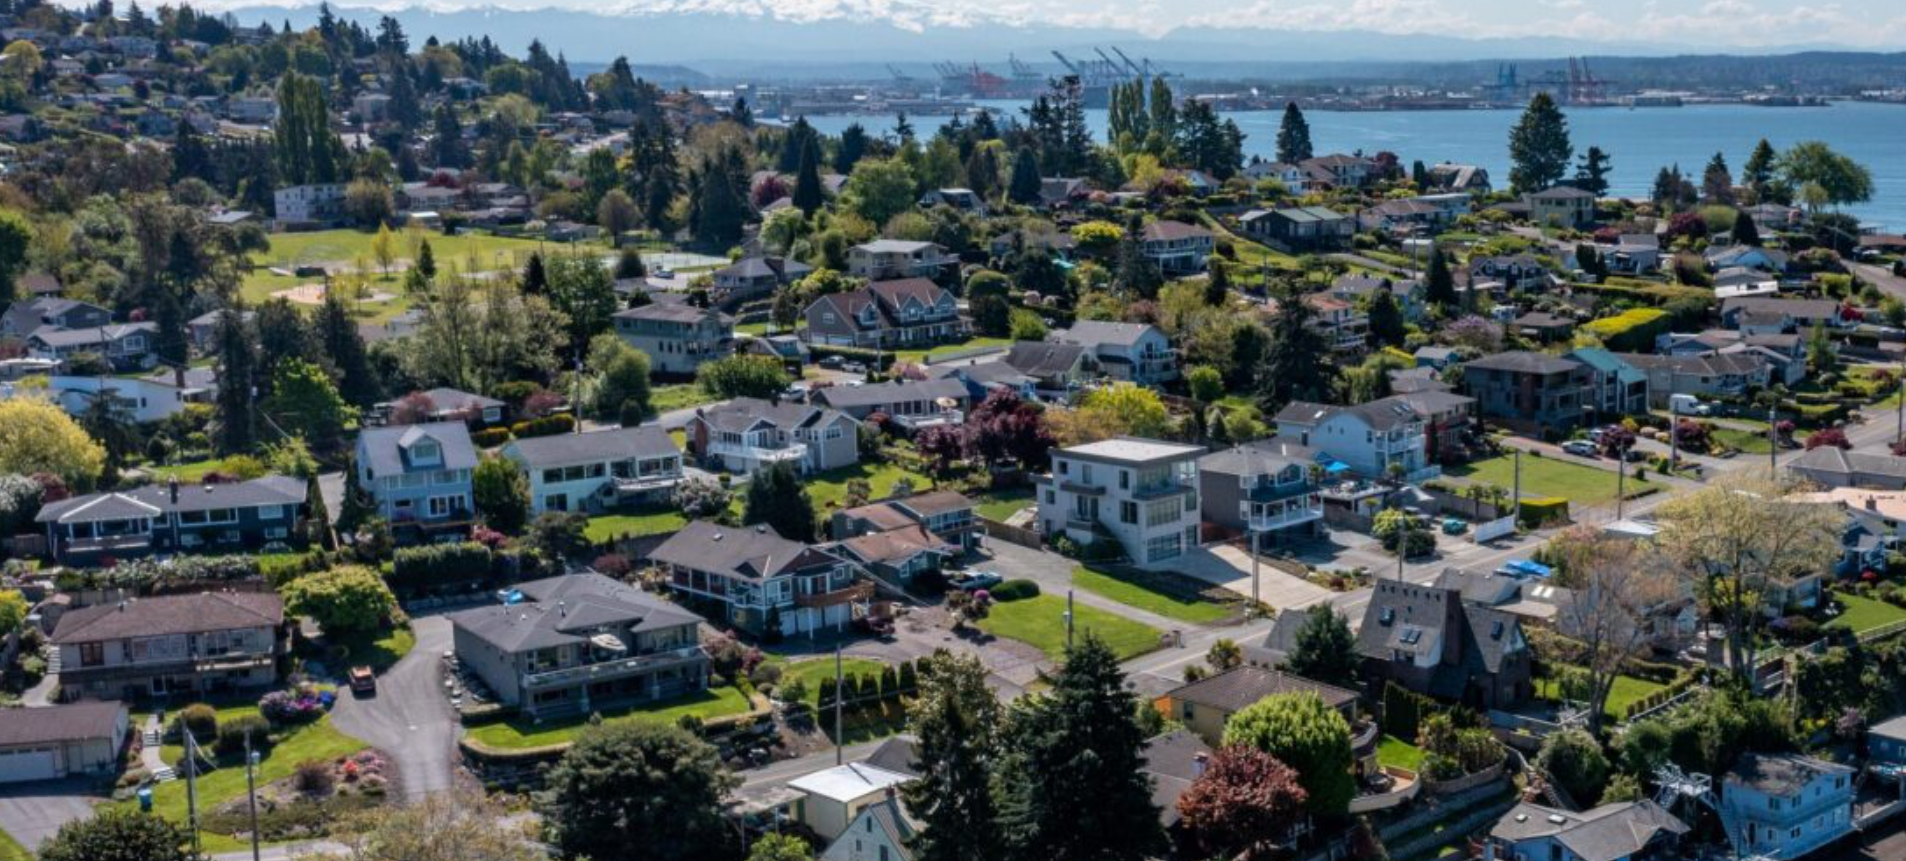
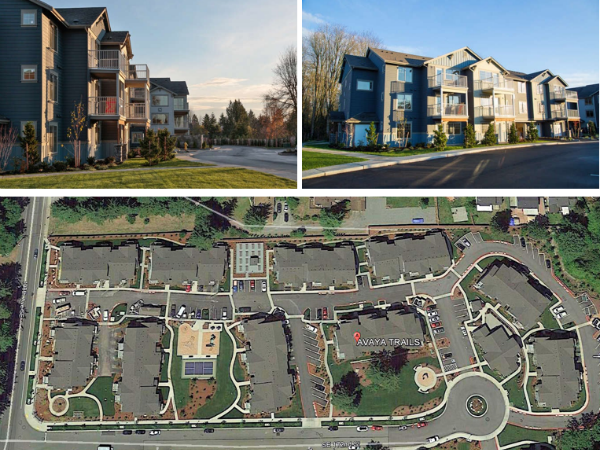
18 Dwelling Units Per Acre (Net)
Notable features: A combination of surface/garage parking and generous open space and recreational features (including children’s play area, sports court, vegetable gardens for residents, trails, common recreational building, and a protected natural area).
27 Dwelling Units Per Acre (Net)
Notable features: Single and double-single family lots redeveloped with condominiums. Each building contains between three and seven units and has front-loaded parking at the street level beneath the dwelling units. All are built within a strict 30-foot height limit; hence, the flat roofs.
34 Dwelling Units Per Acre (Net)
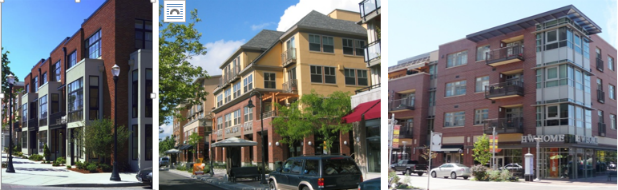
Notable features: An urban, street-oriented townhouse development integrating corner retail spaces, live-work spaces, internal auto courts with private garages, and common open space.
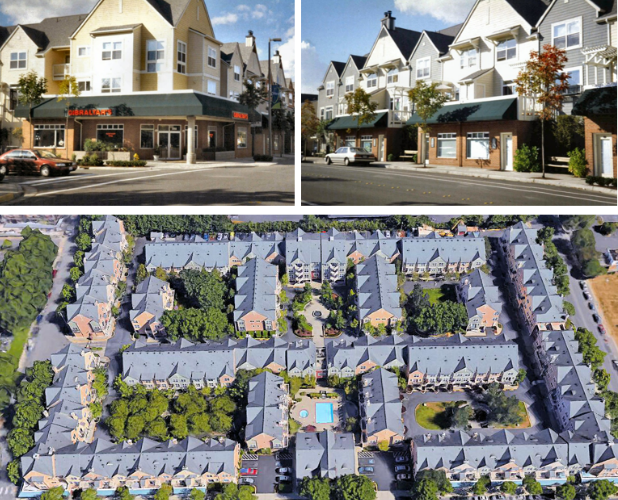
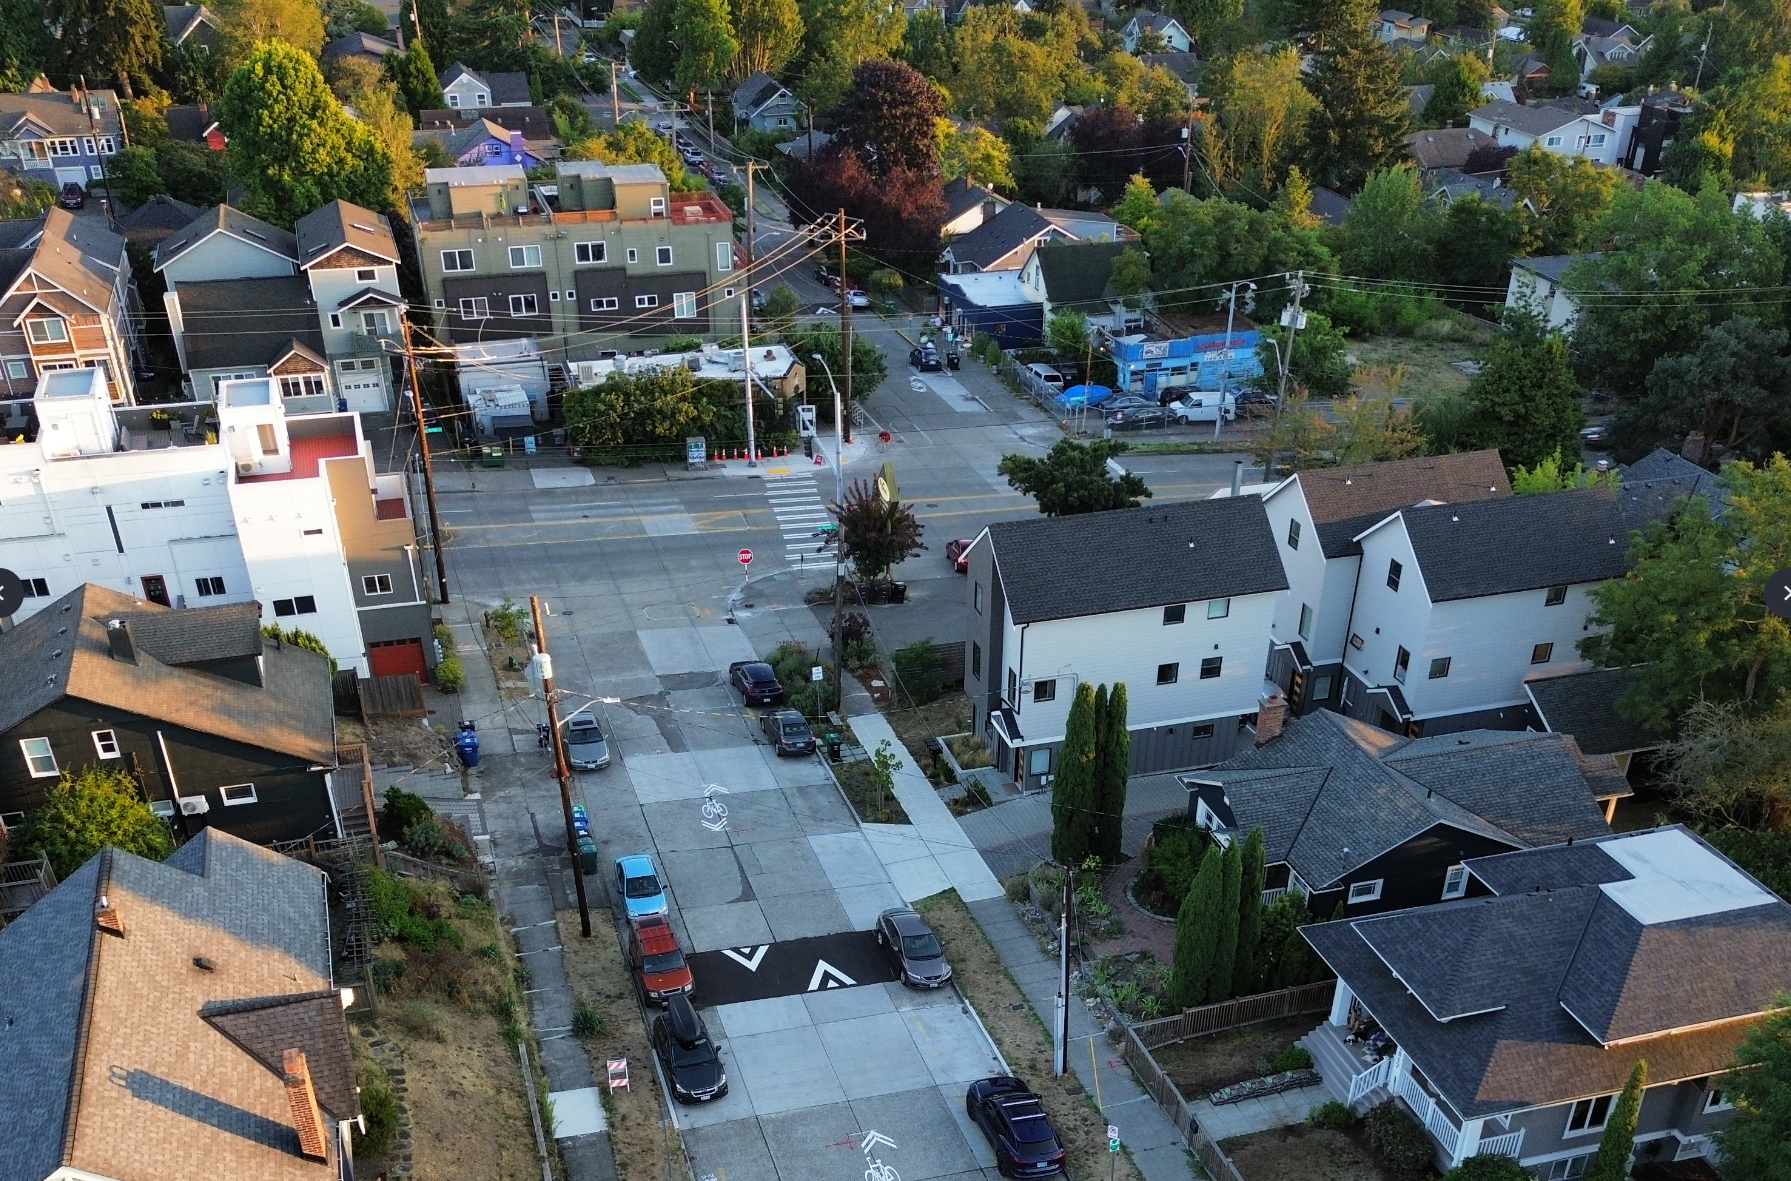
36 Dwelling Units Per Acre (Net)
Notable features: A cluster of single-family homes integrated into surrounding neighborhood with alley and internal auto-court access, private garages, a large cedar tree, and a manmade stream running through the site.

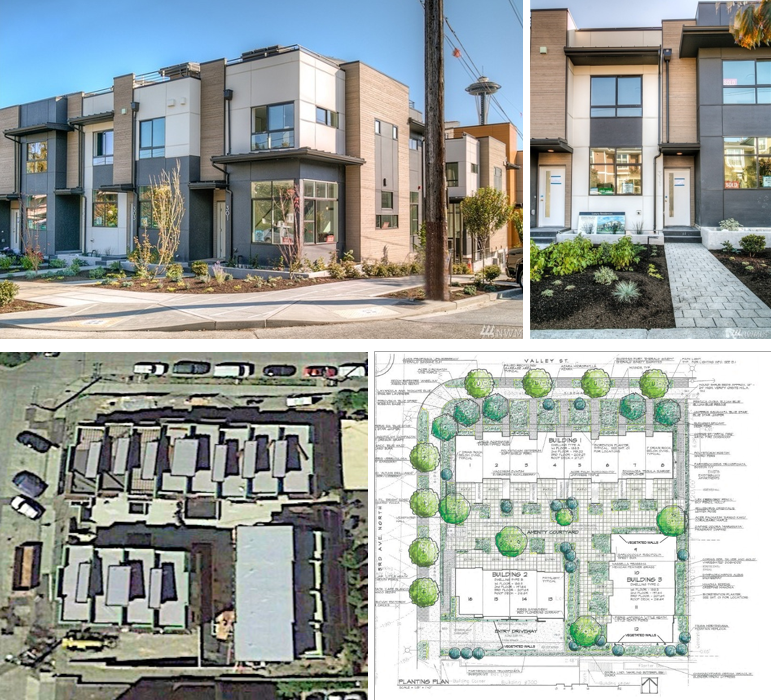
44 Dwelling Units Per Acre (Net)
Notable features: New urban townhouses and live-work units served by underground parking and containing private patios and a centralized, shared courtyard space.
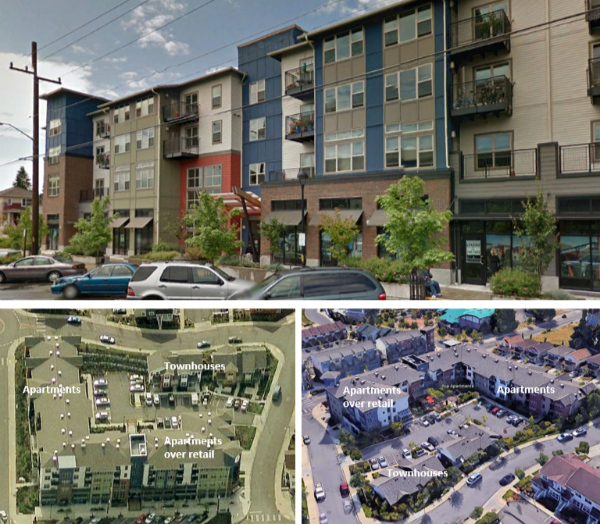
59 Dwelling Units Per Acre (Net)
Notable features: The whole block site transitions from four-story buildings with ground level retail to townhomes that rise only one level above the street at the northwest corner of the site. While the L-shaped, mixed-use apartment building is over 100 dwelling units per net acre, the surface parking area and townhouse building bring the block’s average density down to 59 units per net acre.
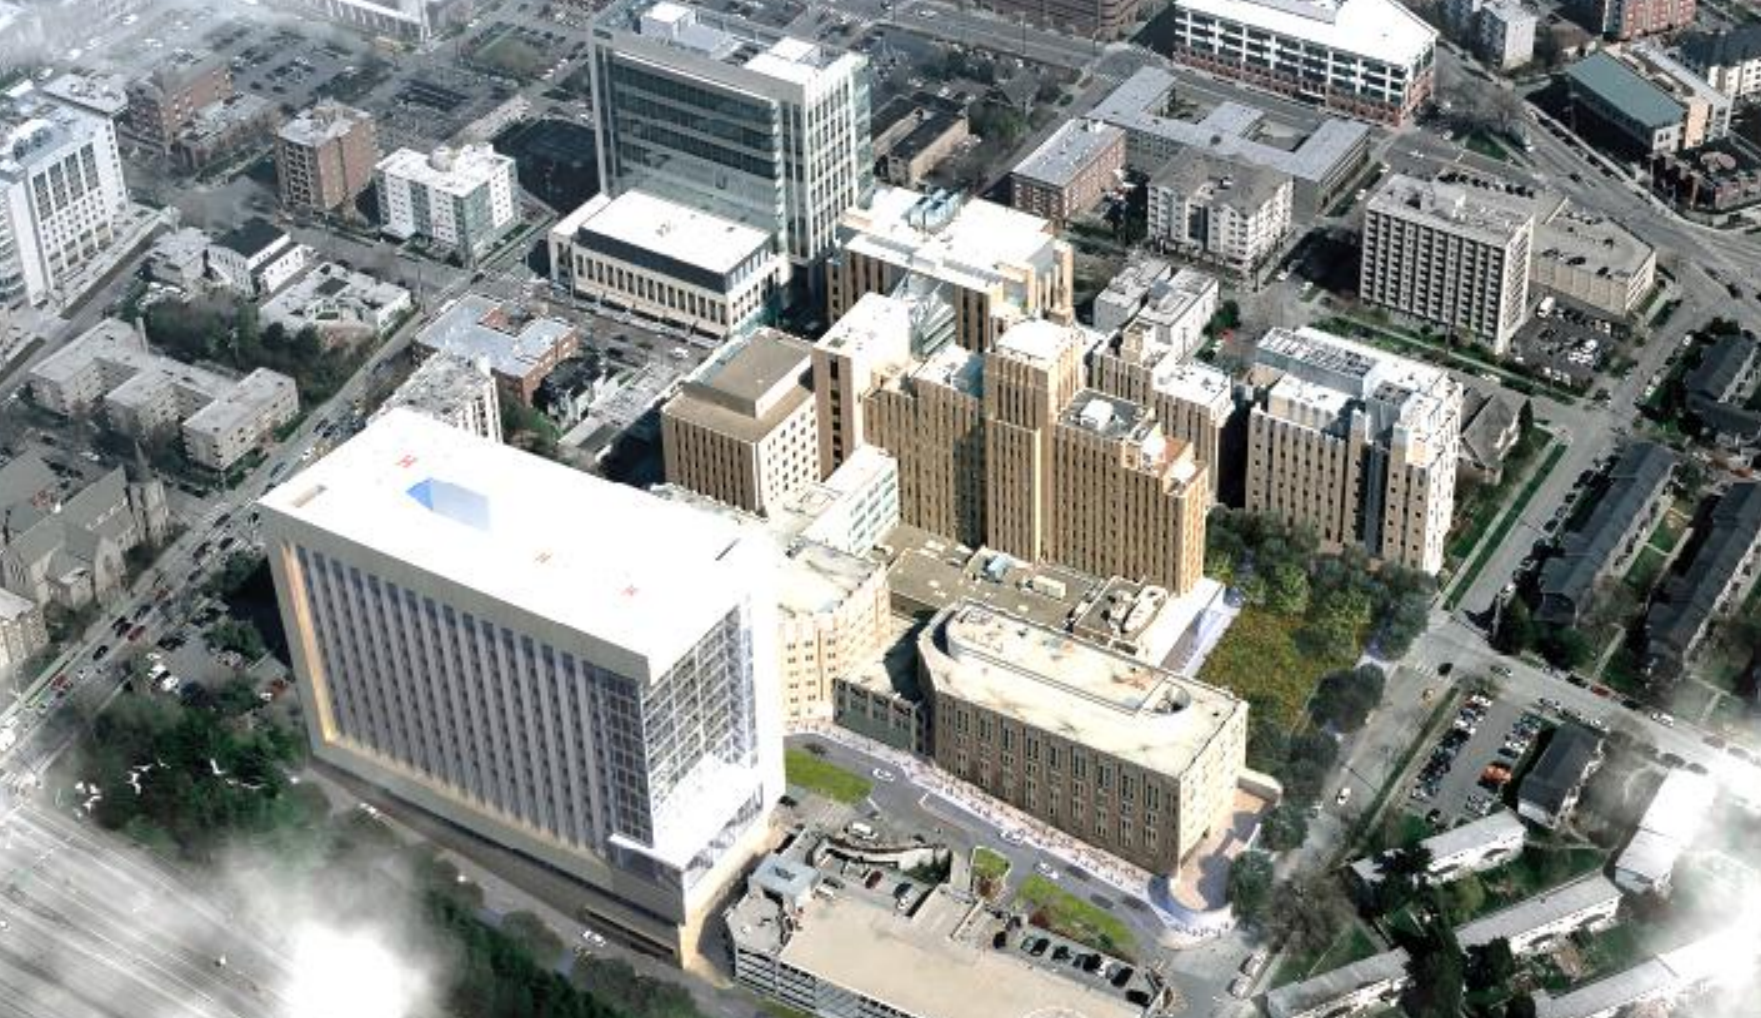
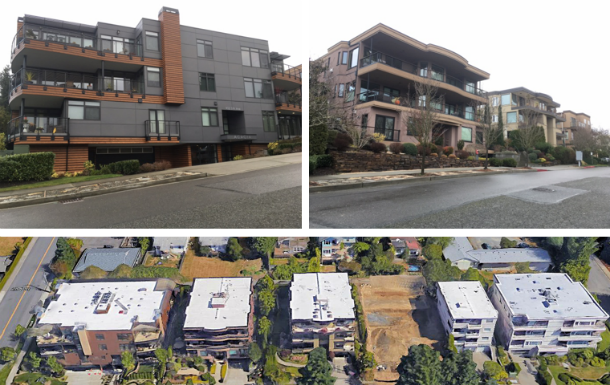
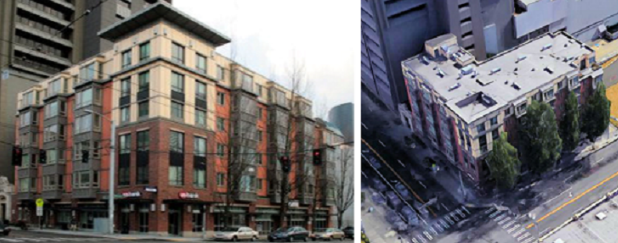
162 Dwelling Units Per Acre (Net)
Notable features: A 6-story, mixed-use apartment building in the very urban, First Hill neighborhood.
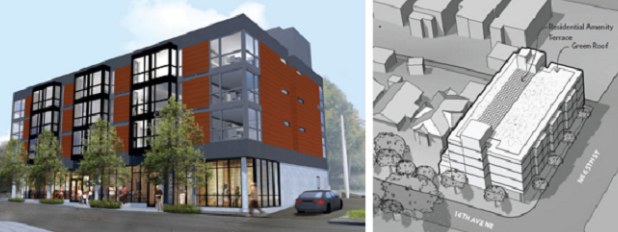
205 Dwelling Units Per Acre (Net)
Notable features: This mixed-use project now under construction features 41 studio apartments averaging only 430 square feet. The trend in smaller units in urban areas results in a much higher density count than would be assumed in looking at this four-story building. It replaces two single-family homes and features only eight parking spaces but will be within walking distance of a future light rail station.
Conclusions: What Makes Density Compatible?
Some quick observations about the examples above and key elements that make them appear more or less livable or attractive.
Good streetscape. Since the most common perception of cities is from our view at street level, the quality of the streetscape in front of the buildings makes perhaps the biggest impact in humanizing developments and softening the hard edges of buildings. Street trees are present in all of the examples above, except the very first example in Ellensburg, and it’s notable that new streetscape standards for Ellensburg now require planting strips with trees! The mixed-use building photos above were all taken during the wintertime. Summertime photos from the same vantage point would certainly soften the edges of those buildings!
Vehicular access elements. Streetscapes dominated by views of garages tend to create more of a dehumanized setting. While they may not necessarily make a streetscape feel more dense, the garages certainly degrade the visual character. The Issaquah Highlands examples above are particularly successful in locating and designing garages and driveways in a manner that minimizes their visual impact on the streetscape.
Building design. There are a number of building features that can impact a person’s perception of the building.
- Façade massing. Large buildings featuring good articulation techniques that break down the perceived scale of the building and add visual interest will appear less dense than a boxy and poorly detailed building.
- Façade materials & detailing. Buildings with materials and detailing that add visual depth and interest to a view will also be perceived as less dense and more livable.
- Variety. While some consistency in built form can be good and help to establish a sense of place, monotonous designs (particularly those with poor streetscapes, façade massing, materials, and detailing) can degrade the visual character and make the area feel denser than it is.
The following planners provided assistance in this piece: Steve Butler and Byron Katsuyama (MRSC), Jeremy McMahan (Development Services Planning Manager, City of Kirkland), Chip Vincent and Clark Close (Long Range Planning Director/ Senior Planner, City of Renton), Gary Lee (Senior Planner, City of Redmond), Lisa Rutzick (Design Review Program Manager, City of Seattle), Joming Lau (Urban Design, MAKERS), and Sean McCormick (Urban Designer, MAKERS).
This article is a cross-post that originally appeared on MRSC Insight Blog.
Bob Bengford, AICP, is a Partner with MAKERS architecture, planning and urban design firm. Bob’s community design work encompasses all transects, from urban downtowns and transit-oriented development to rural area planning. Since joining MAKERS 13 years ago, Bob’s specialty has been helping communities craft usable development regulations and design guidelines. The combination of growing up in a sprawling Orange County (CA) tract home subdivision, reviewing development plans against antiquated and inconsistent codes in rural Bonner County (ID), and working with a great mentor at MAKERS (John Owen) have helped Bob recognize the critical importance of good development regulations and design guidelines in shaping vital and healthy communities. As a resident of Bellevue, Bob has been active in various community planning issues. He’s also an active four-season bicycle commuter, hiker, gardener, and urban explorer.