Safe biking infrastructure still has a long way to go in Bellevue--but building it is worth it. (Photo by Chris Randels)
Safe biking infrastructure still has a long way to go in Bellevue--but building it is worth it. (Photo by author)

Urbanists looked at Paris with envy when the city’s mayor, Anne Hidalgo, in her bid for reelection, advanced her vision for the French capital to become a “15-minute city.” Under this framework, new developments would be planned and infrastructure would be retooled so that all the necessities of day-to-day life could be accessed within 15 minutes’ time without using a car. The reduced auto use from switching to such a planning paradigm not only directly benefits residents’ health and safety, but also serves as an important tool in reducing urban greenhouse gas emissions.

In 2016, passenger vehicles alone comprised over half of Seattle’s emissions, and electric cars will not save us in time to avert the looming impacts of the climate crisis. If we’re really going to reduce emissions by 45% by 2030 (less than ten years from now!) like our state mandated in last year’s Clean Energy Transformation Act (CETA) legislation, every city in Washington needs to play their part and considerably reduce our state’s largest contributor to greenhouse gas emissions: motorized vehicles.

Emphasis on every city.

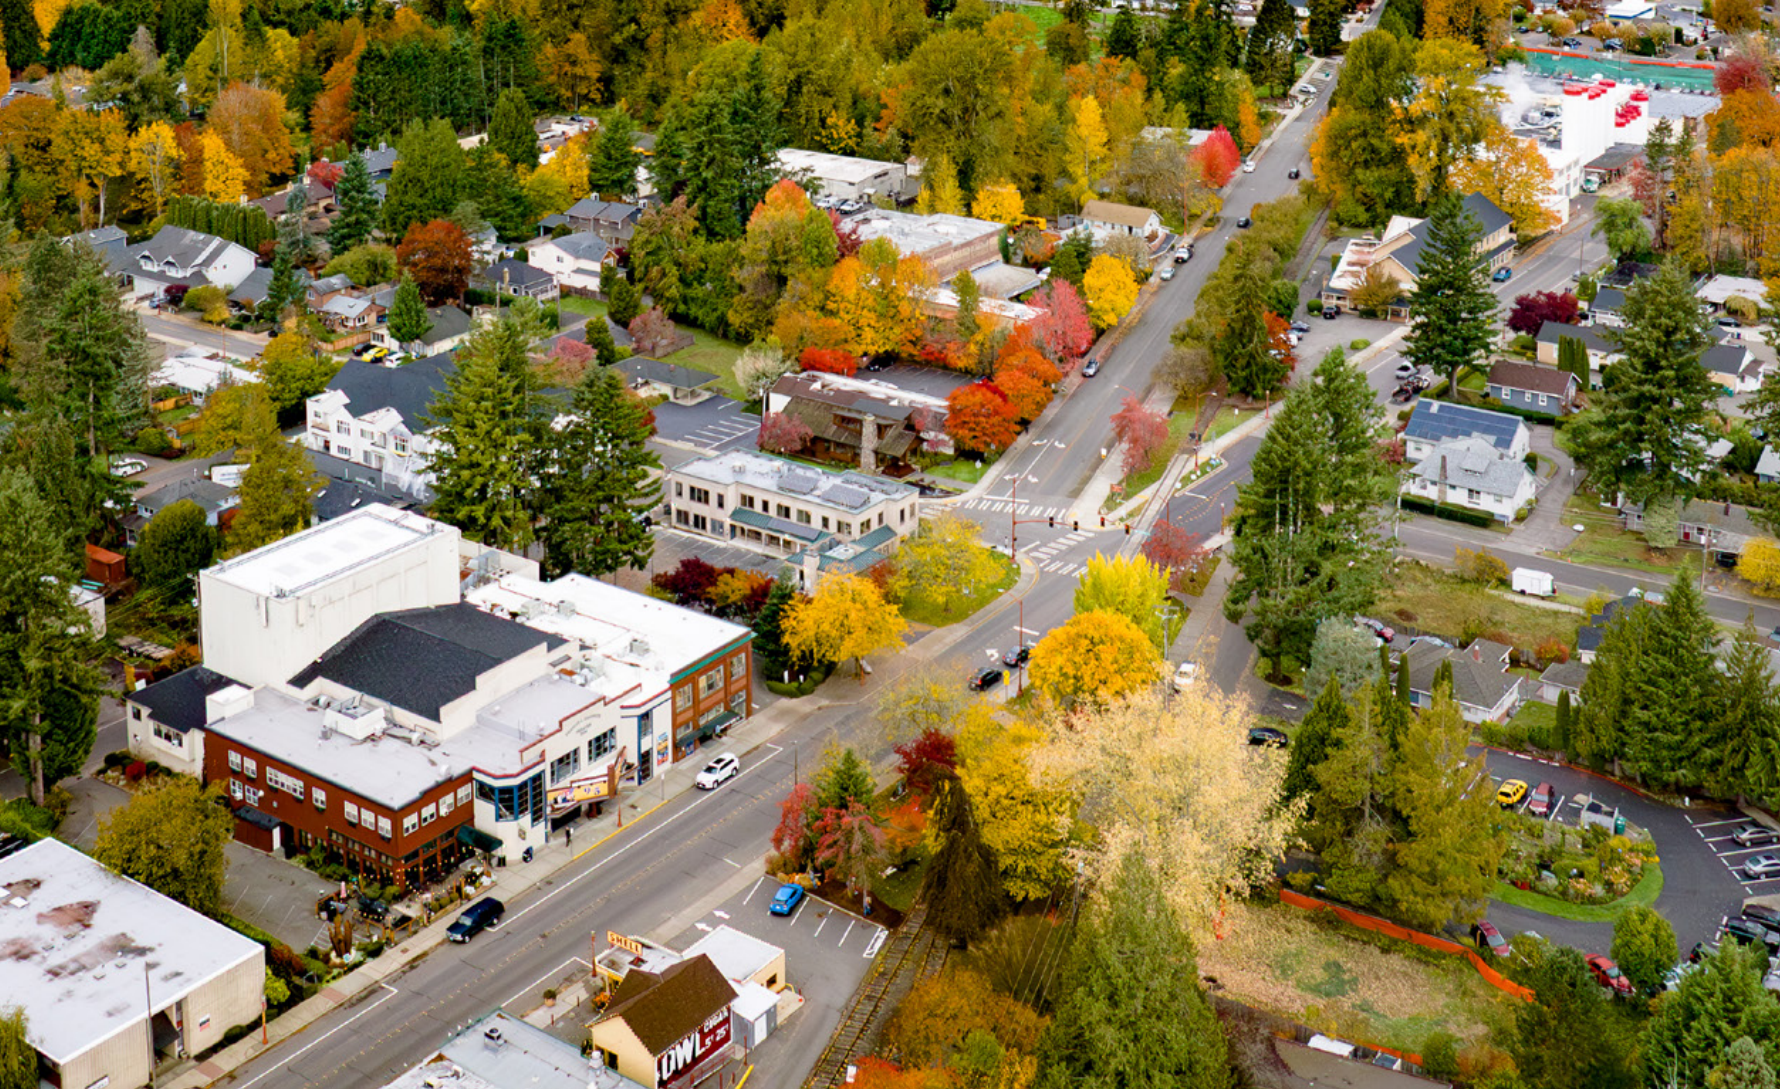
In Bellevue–the most populous city on the Eastside, a regional center of technology and commerce, and my home–the transportation sector accounted for 43% of our emissions in 2018. However, we lag far behind Seattle in our cycling infrastructure, and although we have dedicated transportation staff who are passionate about seeing our city make the necessary changes, new obstacles seem to appear at every attempt for progress. From community opposition organized through the platforms of conservative political consulting firms, to anti-transit and anti-cycling organizations having uninterrupted time with important elected officials, to said organizations having had people in key positions of power in the city’s decision-making process for transportation infrastructure, it can really feel hopeless sometimes to envision a more car-free future for my city at all.

Even though the city appears to recognize the transportation challenges that increased population and commerce will bring, it can feel that Bellevue is too far gone to fundamentally change–that we’re too entrenched in automobile-friendly infrastructure, single-family zoning, and love of our metal boxes to be able to make the necessary transformative changes. 

But are we really

Even with over 75% of Bellevue’s land zoned as single-family, residents can still have quick bike access to many important day-to-day destinations. (City of Bellevue)

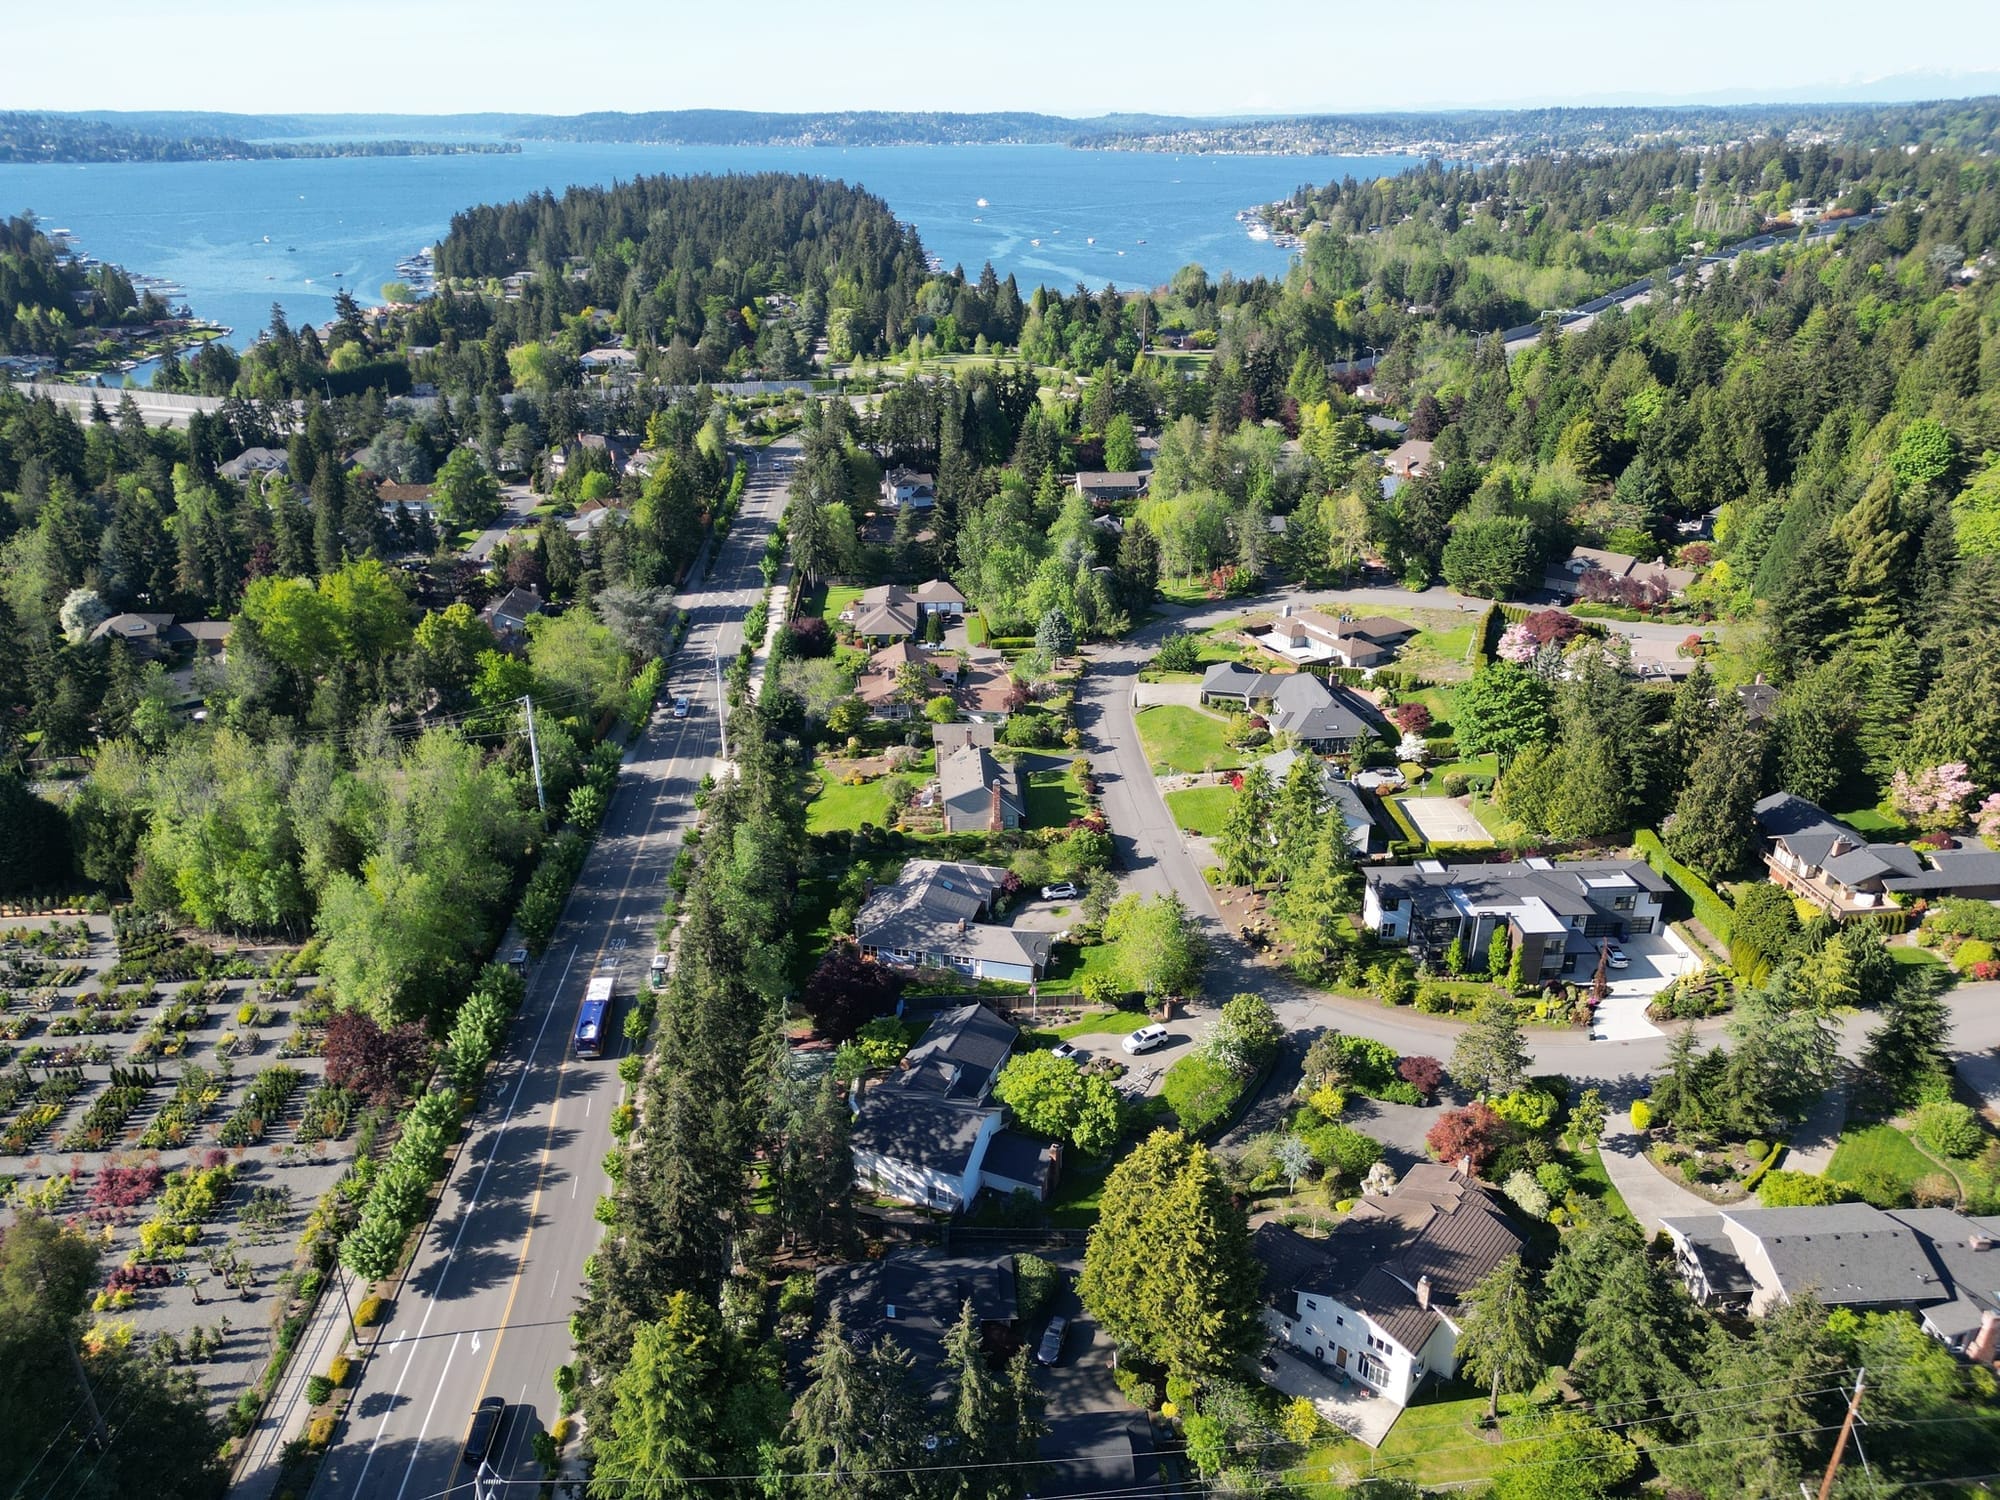
Paris’s vision of the 15-minute city presents a novel opportunity for urbanists worldwide–not only a method to measure our future progress, but a metric by which we can assess our current status. With significant swathes of Bellevue dabbled with low-density developments and single-family housing, it’s easy to overlook the potential that the city, even in its current form, can have to transition to greener infrastructure. In all four corners of Bellevue, there are pockets of businesses and development that can provide day-to-day goods and services to our city’s residents even without a car. Although our roads are primarily configured for automobile traffic, what if they weren’t? What if the City of Bellevue were to delineate our roads as primarily for cycling traffic? How would Bellevue fare under this new paradigm? Would residents still be connected to essential goods and services, or would they be as helplessly isolated without the automobile as some fear?

By using the 15-minute city concept as an analysis tool, I was able to separately assess all of Bellevue’s neighborhoods, calculate their access to certain essential businesses via 15 minute cycle trips, and uncover data that challenges our assumptions about what transformations are possible for our state’s suburban cities.

The City of Bellevue is officially divided into 16 neighborhoods of various sizes and densities. By using QGIS tools and online lists of certain retailers’ locations, I was able to determine how many locations of each retail type were accessible in a neighborhood’s bikeable area. For full analysis details, see the author’s note below. (City of Bellevue)
The City of Bellevue is officially divided into 16 neighborhoods of various sizes and densities. By using QGIS tools and online lists of certain retailers’ locations, I was able to determine how many locations of each retail type were accessible in a neighborhood’s bikeable area. For full analysis details, see the author’s note below. (City of Bellevue)

Results

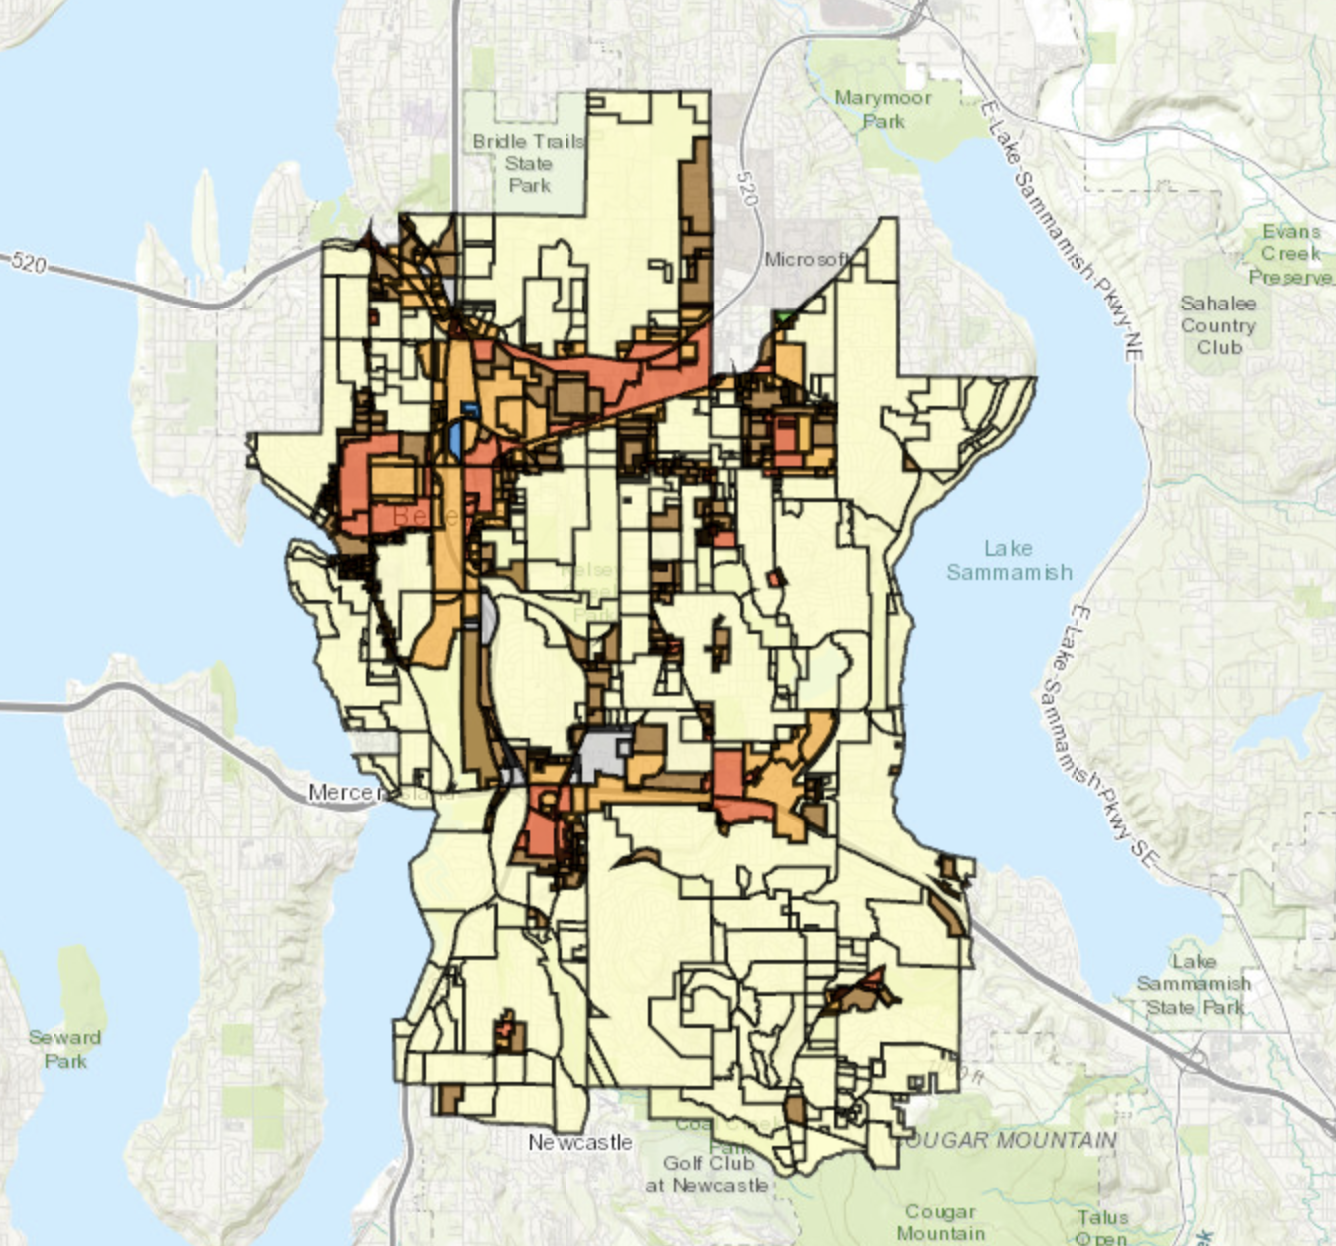
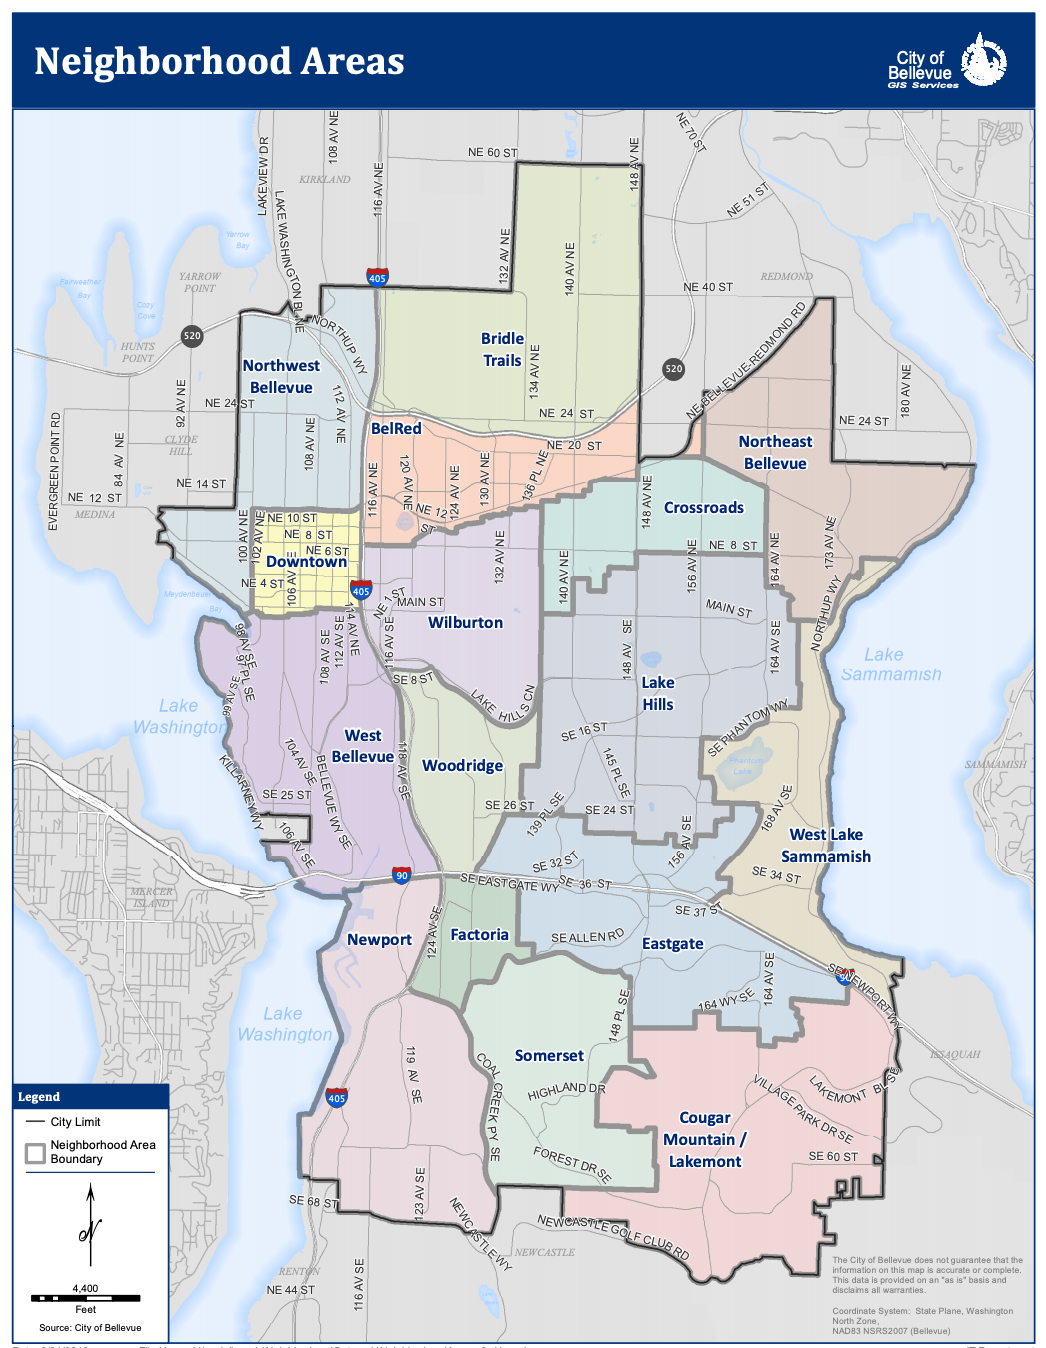
As one might intuitively expect, Downtown Bellevue has the largest 15-minute bikeable area out of all the city’s neighborhoods, at more than 12 square miles. Other neighborhoods with well-connected, grid-like road networks (such as Wilburton, Lake Hills, and Crossroads) also have larger catchment areas.

The size of each neighborhood’s 15-minute bikeable area in square miles. On average, Bellevue neighborhoods can access 9.77 square miles within a quarter hour’s bike ride.

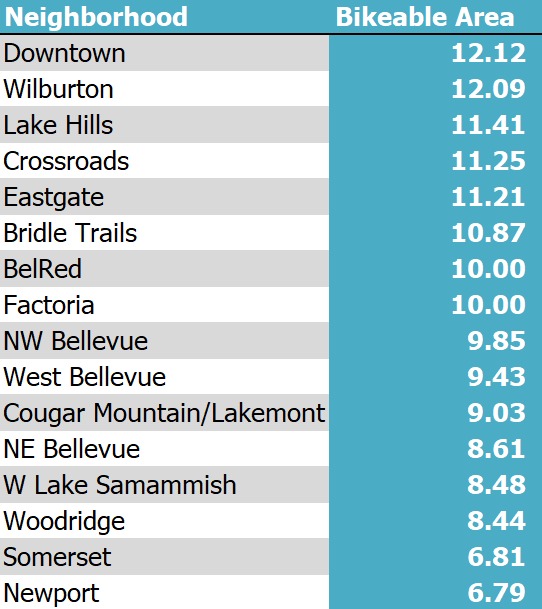
Such gridded networks enable more direct and efficient travel because of their straight lines, which stand in contrast to the windier, more indirect streets common in the subdivisions of NE Bellevue, W Lake Sammamish, and Somerset. Neighborhoods like Newport Hills are further limited by geography; its border with Lake Washington means its catchment area can only extend in three cardinal directions. However, bikeable area size alone is not enough to determine access–it’s important to investigate how many businesses, services, and points of interest fall within these areas to see how neighborhoods stand. 

Businesses

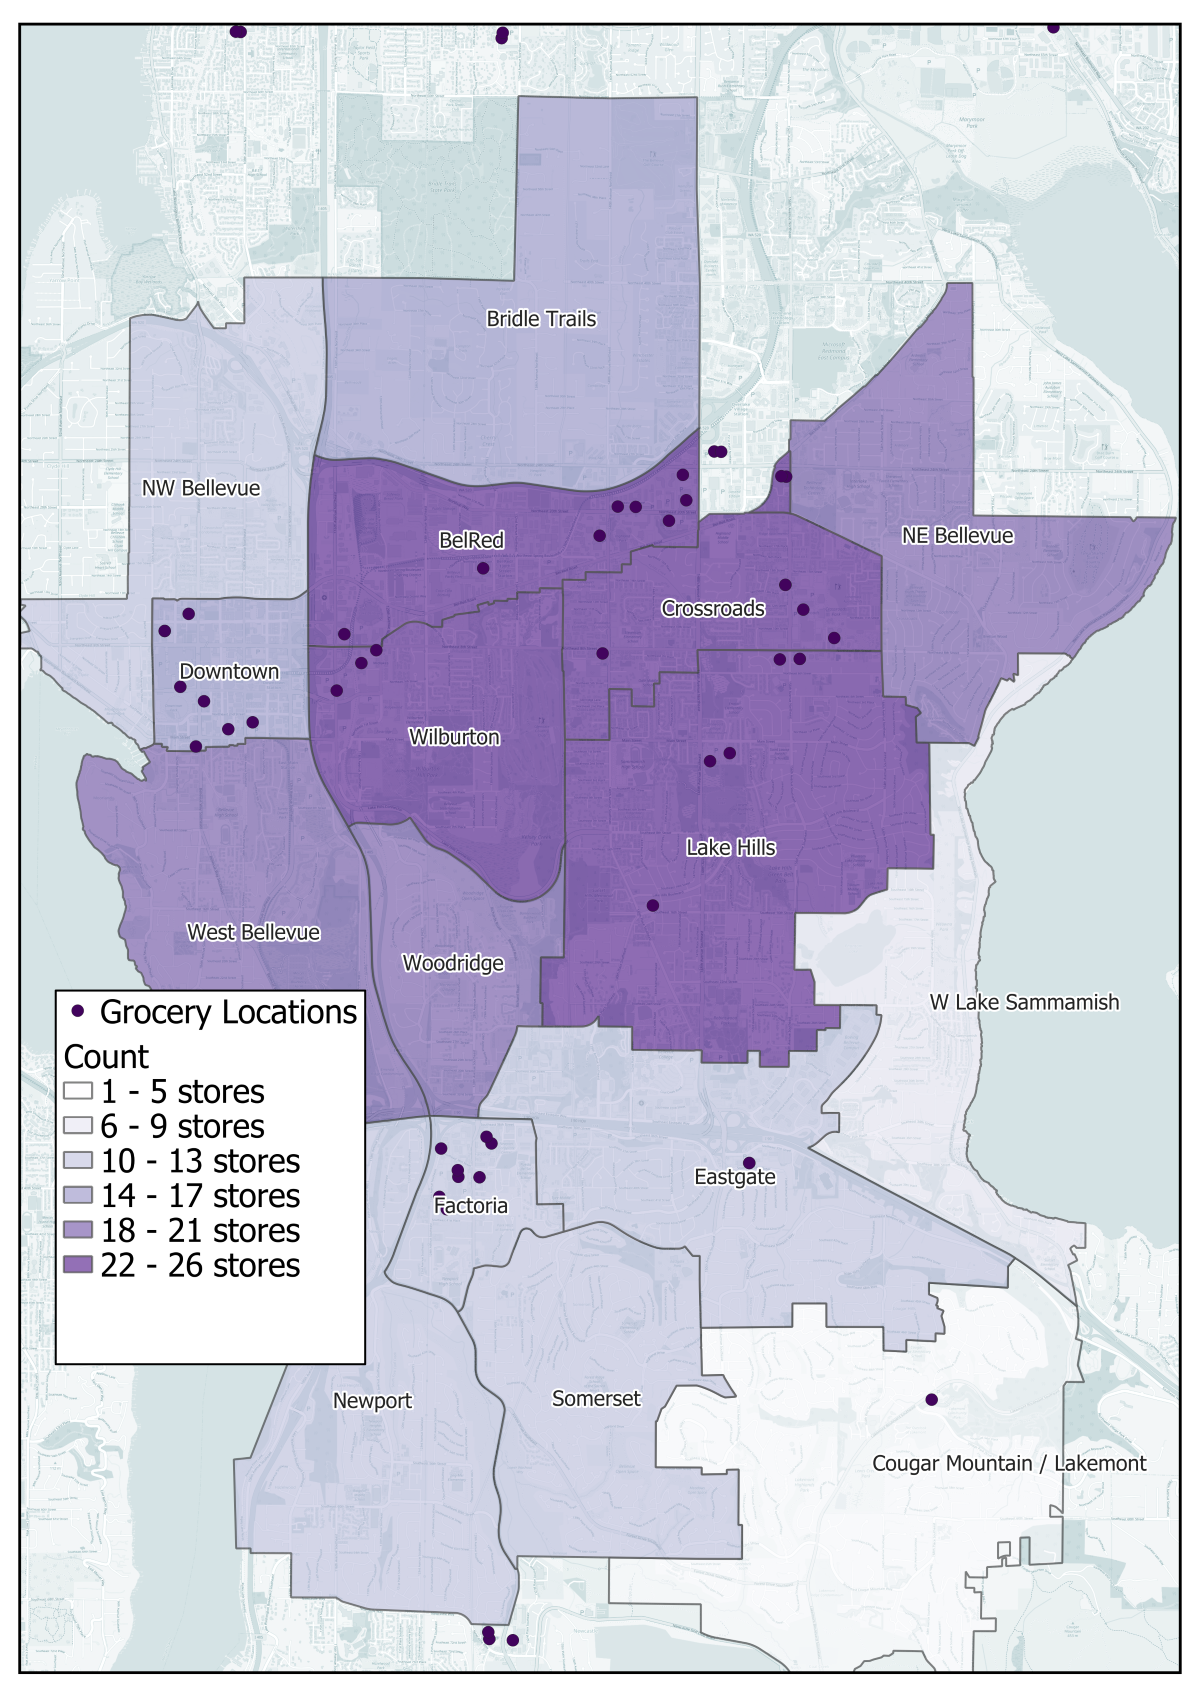
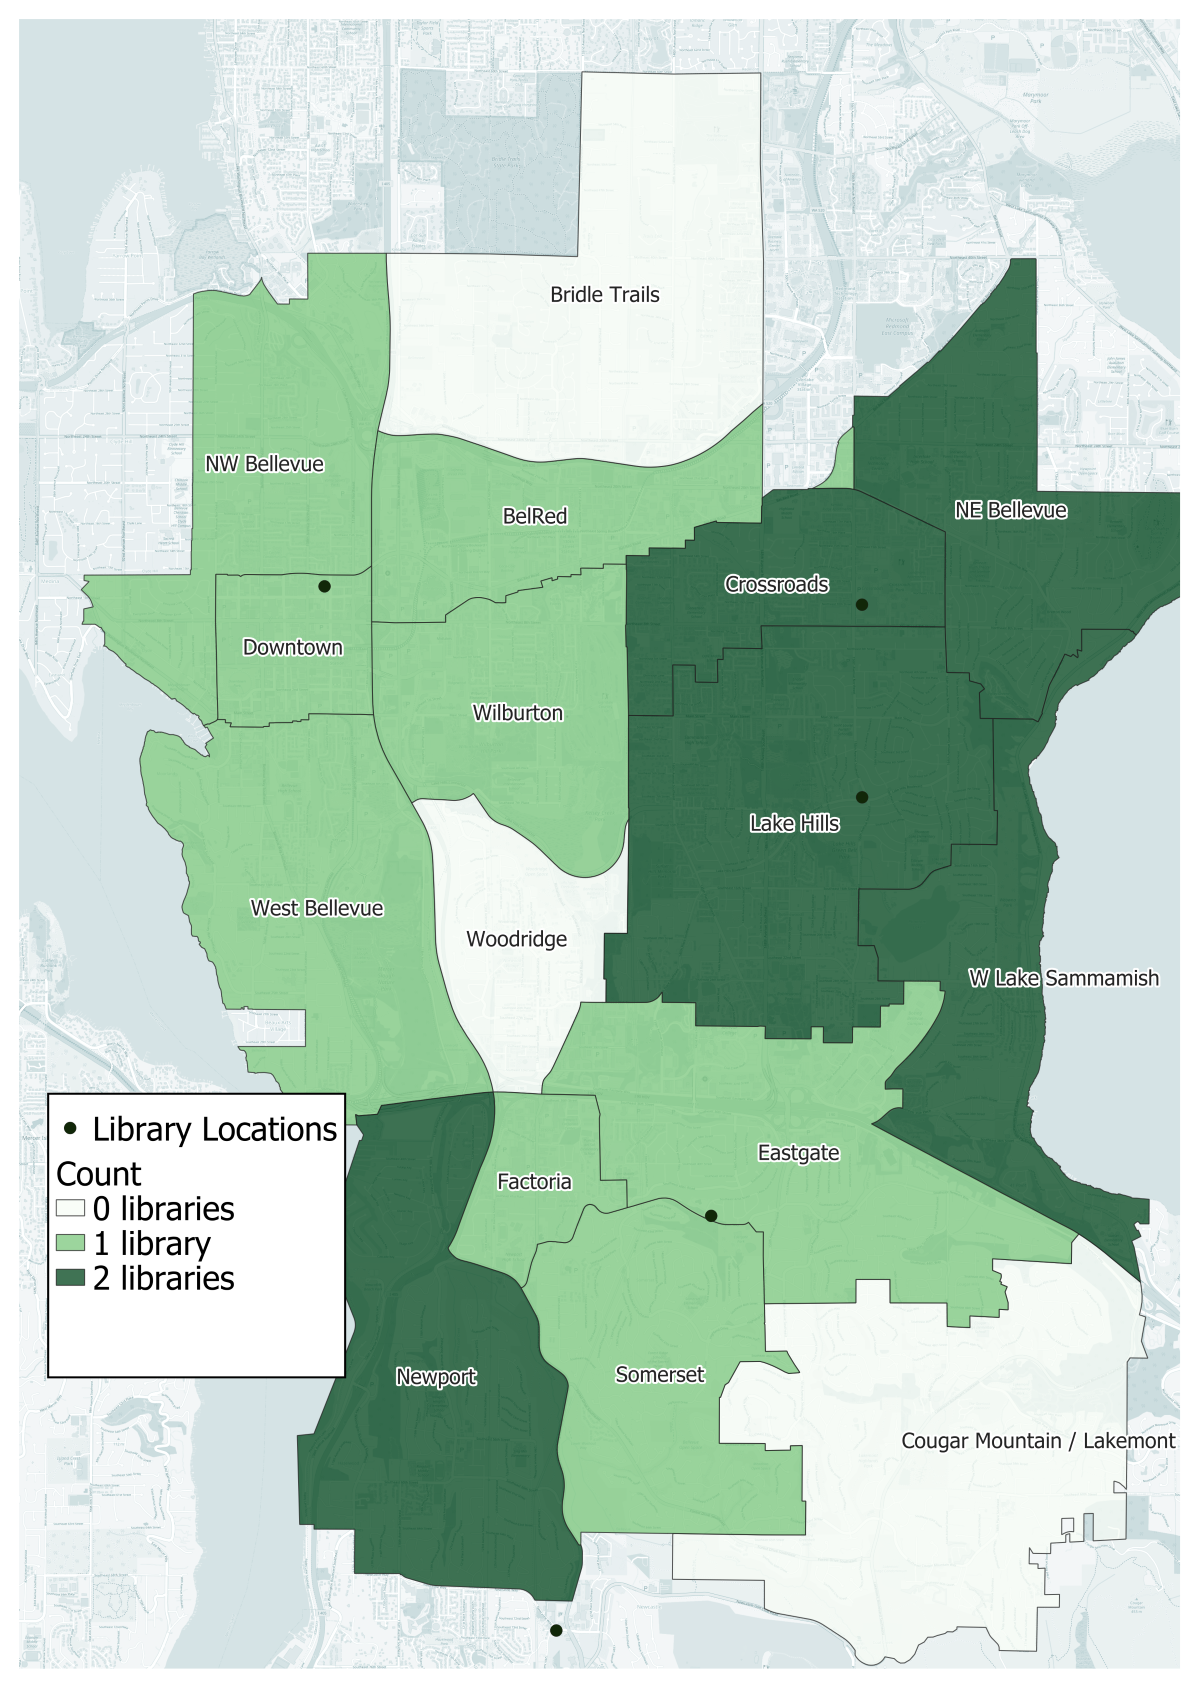
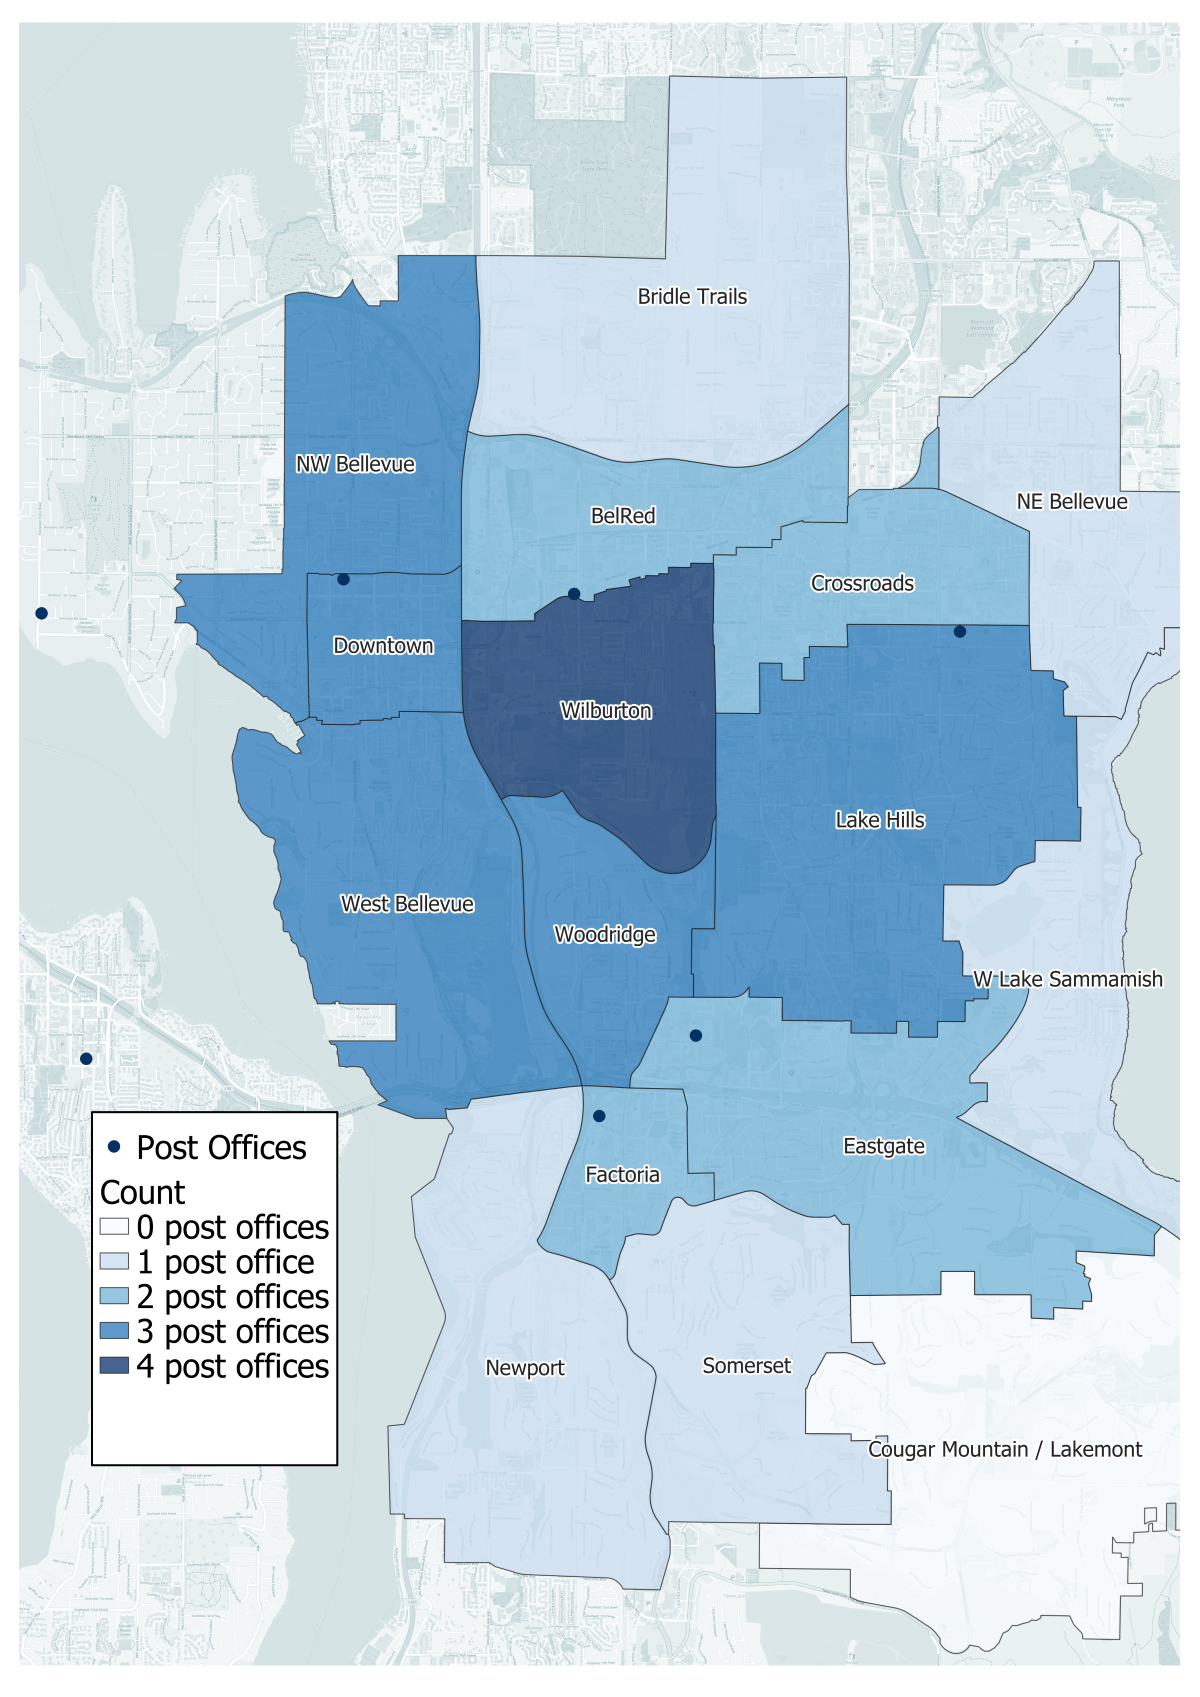
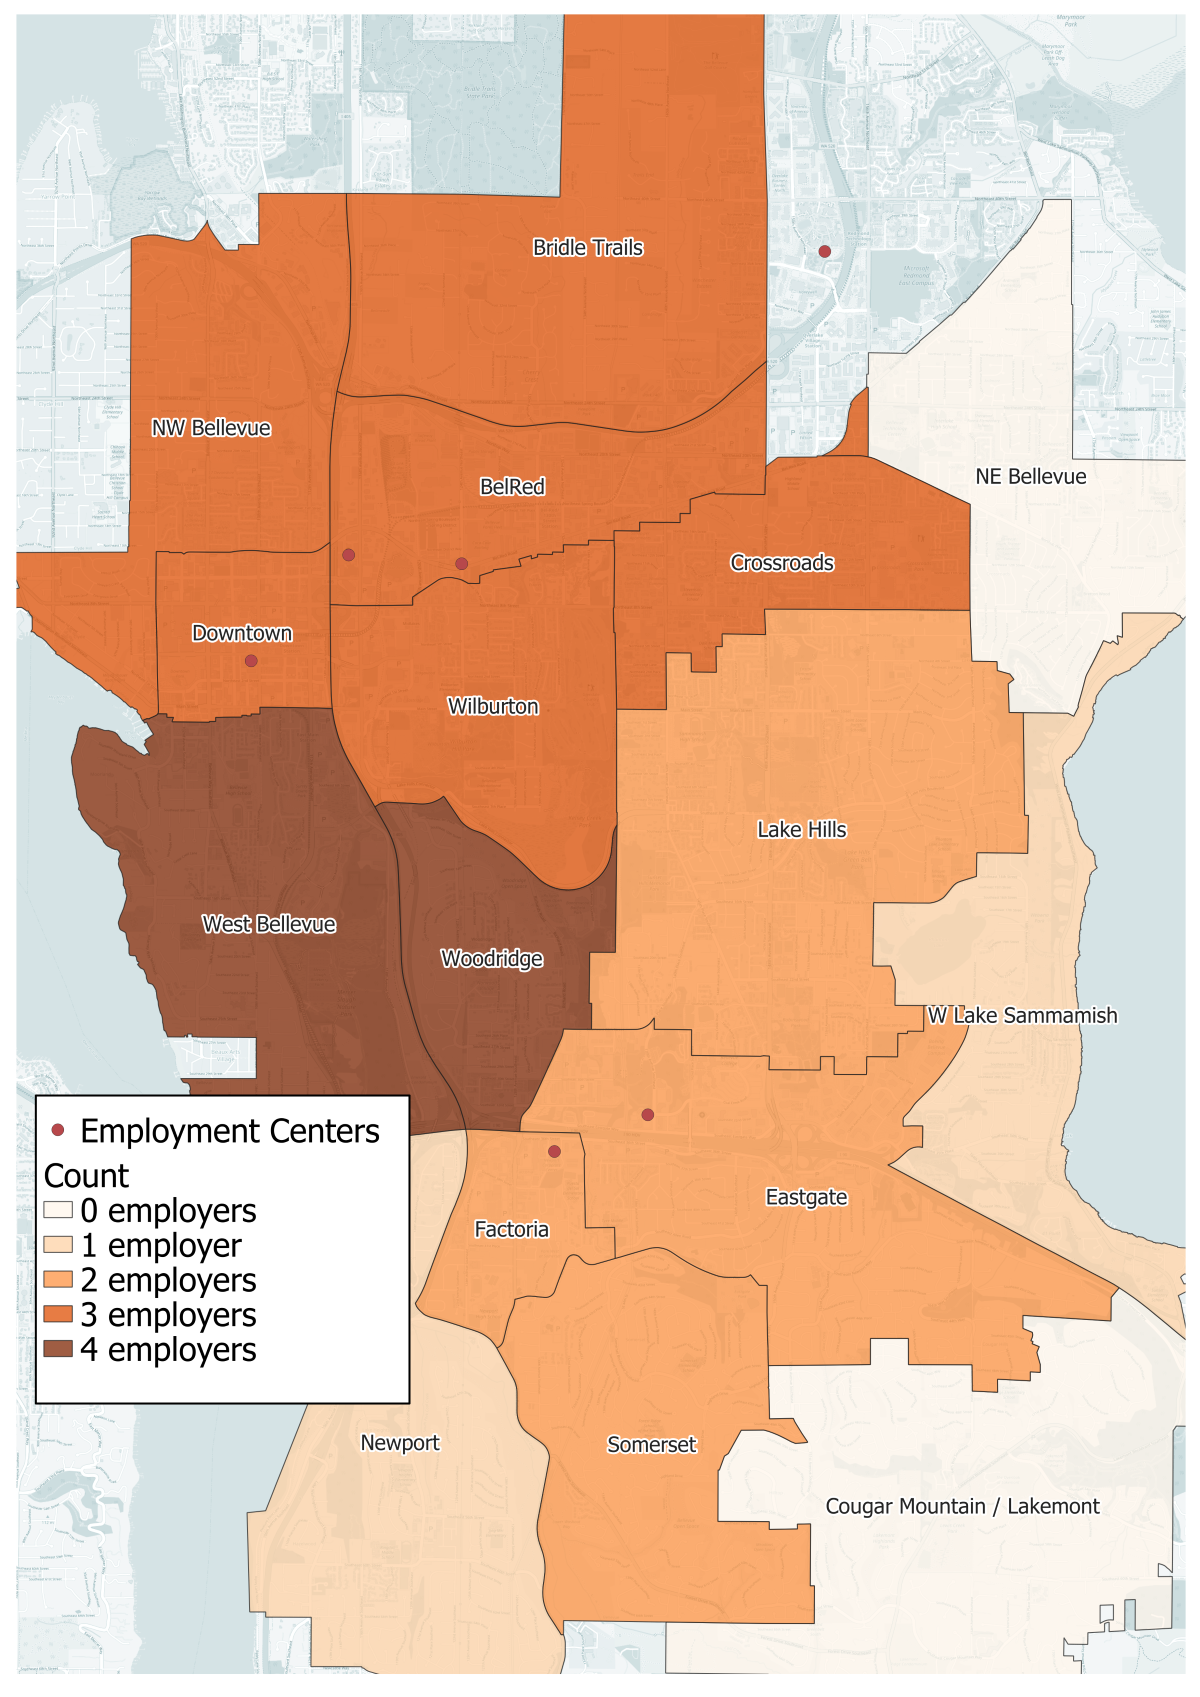
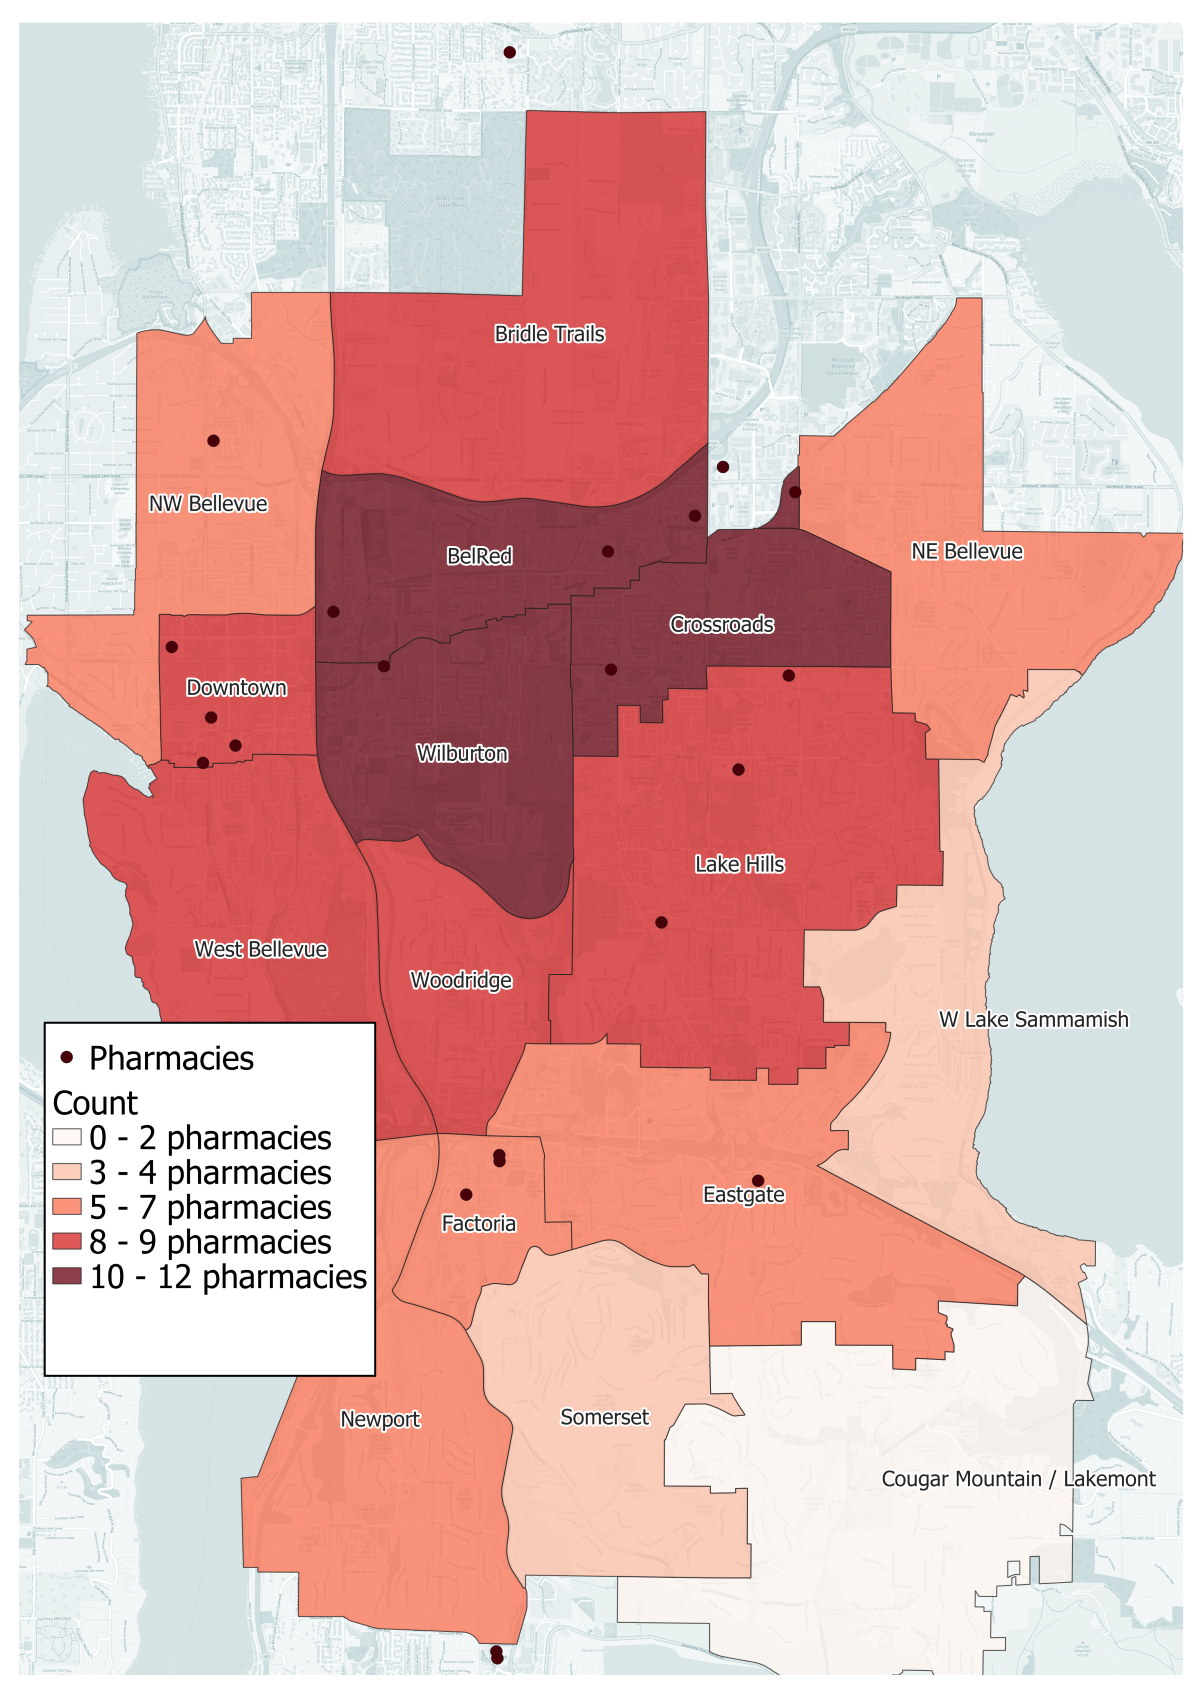
Nearly all neighborhoods had access to at least one business of each type examined (grocery store, library, pharmacy, post office, and major employment centers) within a 15-minute bike ride. Neighborhoods between SR-520 and I-90 consistently had the best access to the destinations examined, while communities on the periphery had more limited access (or none at all). Of particular note is Cougar Mountain/Lakemont, which had no employment centers, libraries, pharmacies, and post offices within a 15-minute bike ride (and only one grocery store). Contrasted with a neighborhood like Wilburton, with its access to three employment centers, a library, twelve pharmacies, four post offices, and 26 grocery stores, it’s evident that there is a disparity in destination access between Bellevue neighborhoods. However, it’s important to note that every neighborhood, except Cougar Mountain/Lakemont and Bridle Trails, has access to at least one location of each destination type, with many neighborhoods having access to multiple. 

Schools

In addition to essential businesses, I also chose to examine Bellevue residents’ access to local schools, but I was required to change my approach. Because which public school one attends is assigned based on address, I instead chose to calculate bikeable areas from the schools themselves (rather than the city’s neighborhoods) and determine what percentage of the school’s attendance area fell within that polygon. It’s important to note that Bellevue School District does not encompass all of the city, and some parts of the district fall outside of Bellevue’s borders. However, the district does serve students from all of Bellevue’s 16 neighborhoods–students’ ease of access to their schools should therefore be a principal concern for Bellevue’s transportation staff. 

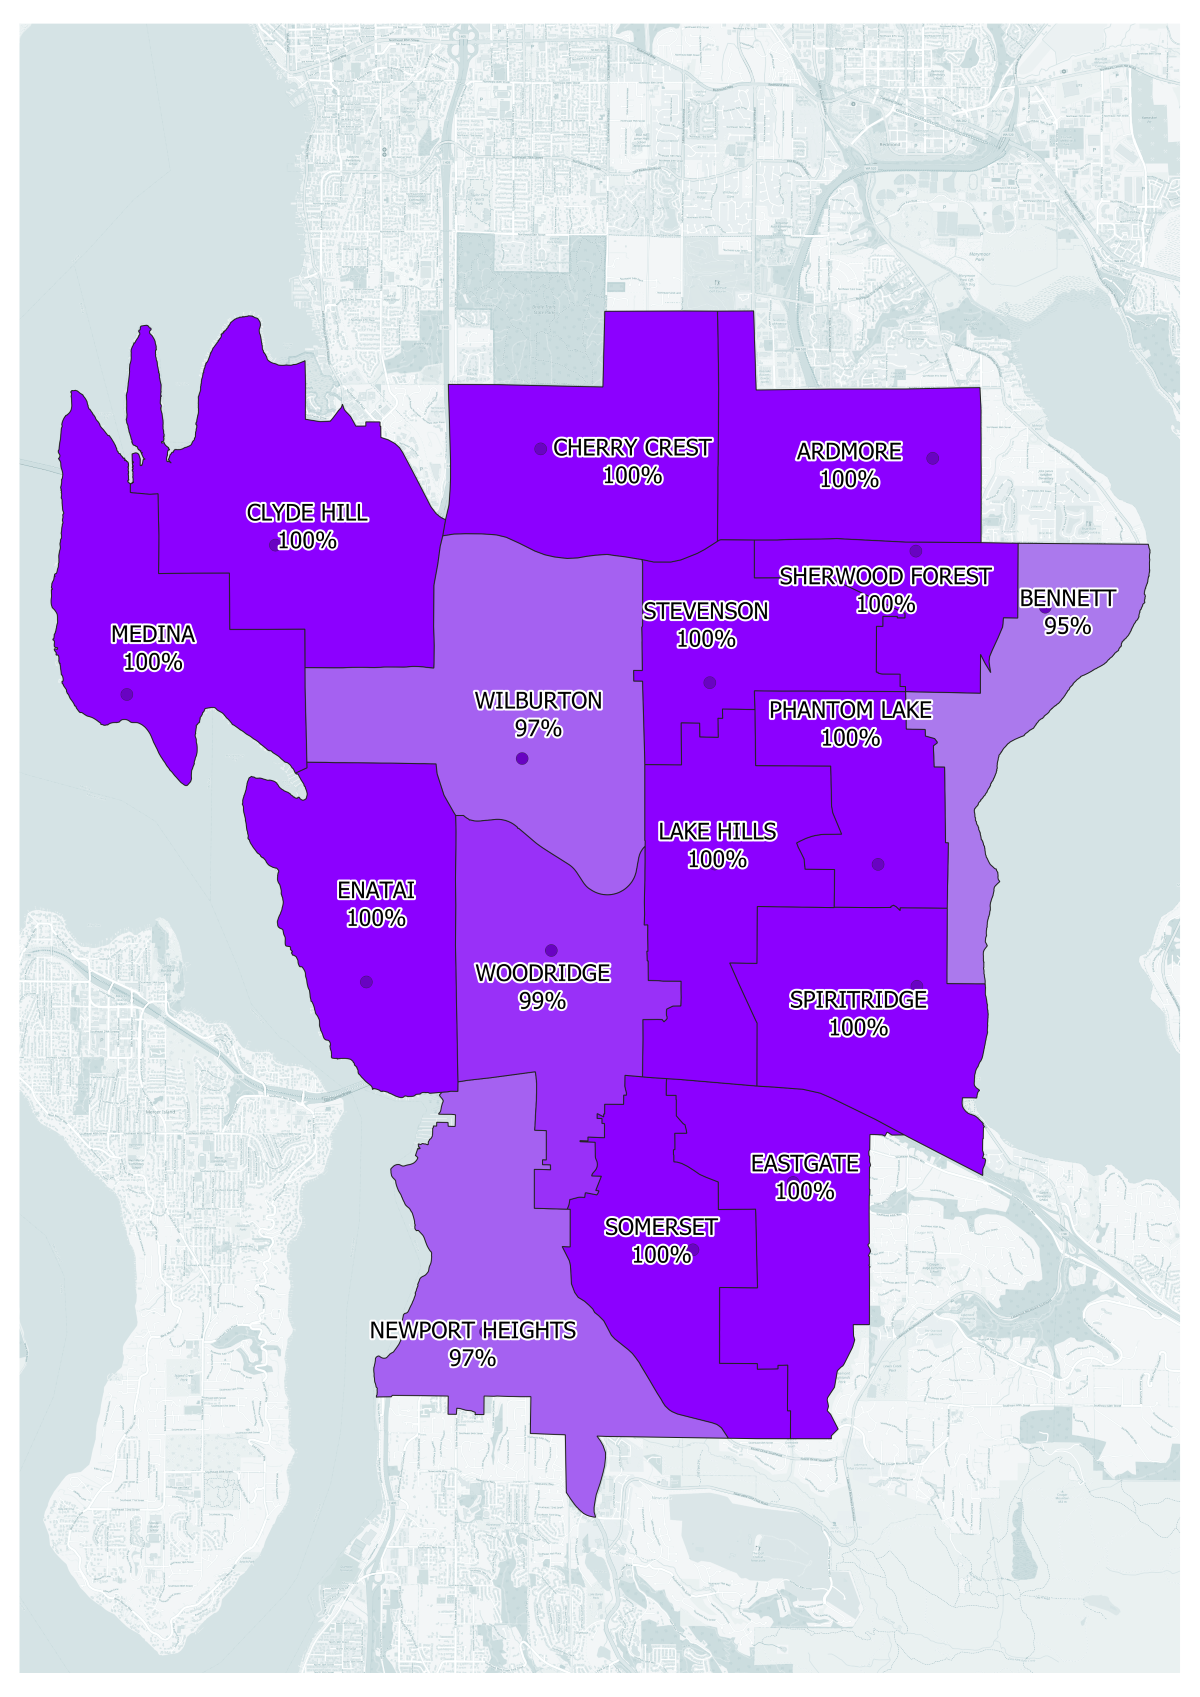
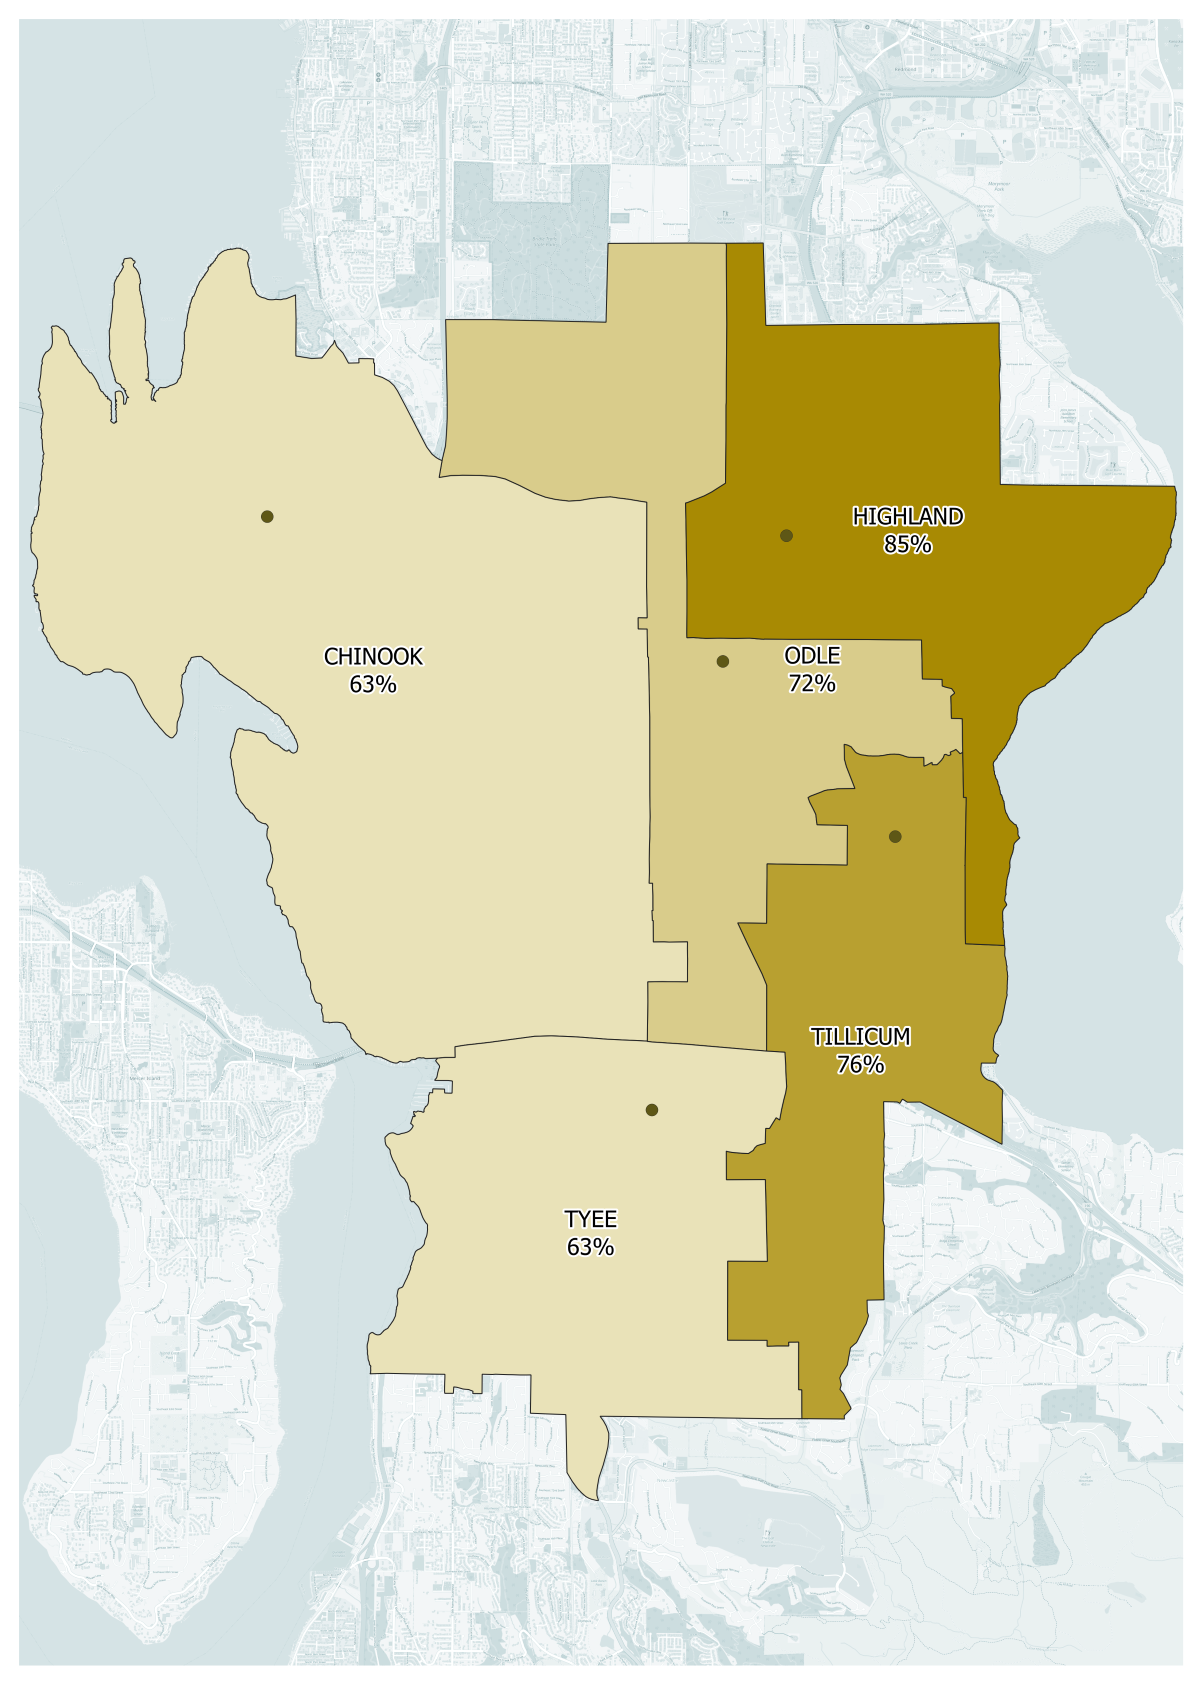
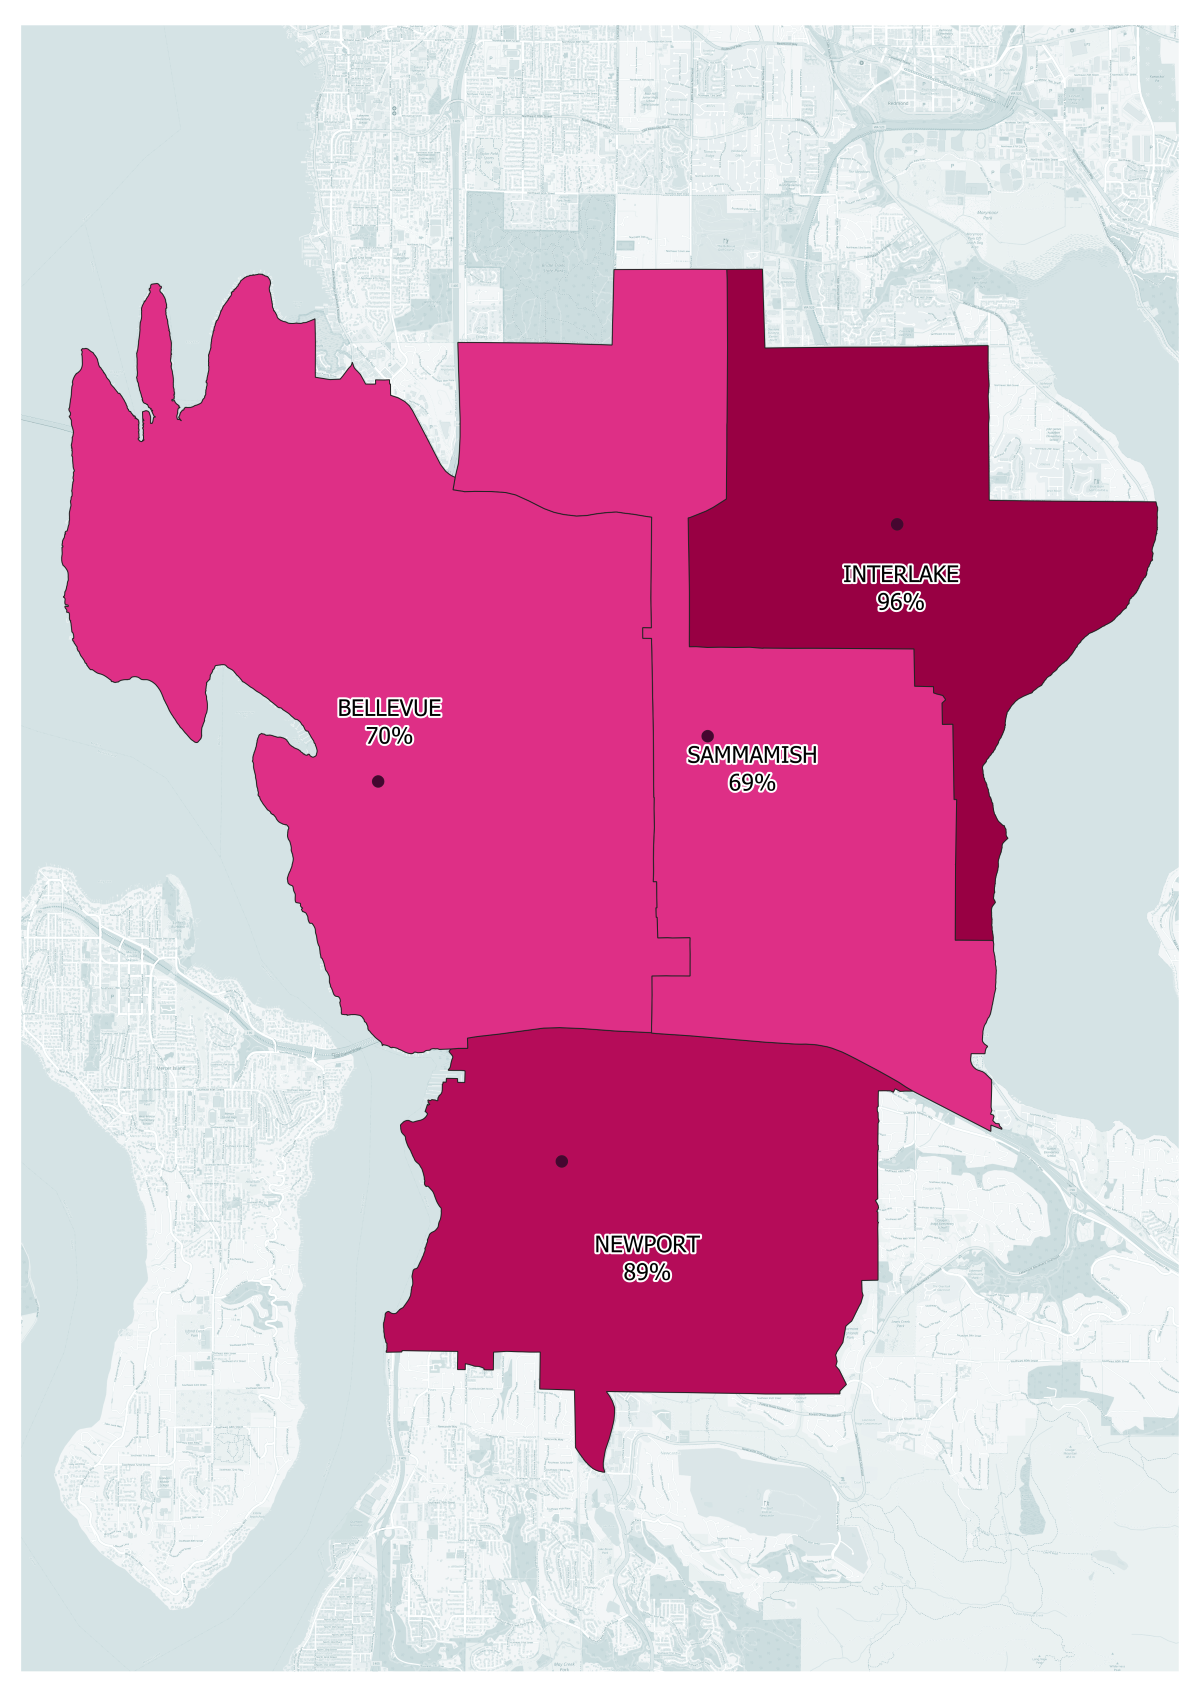
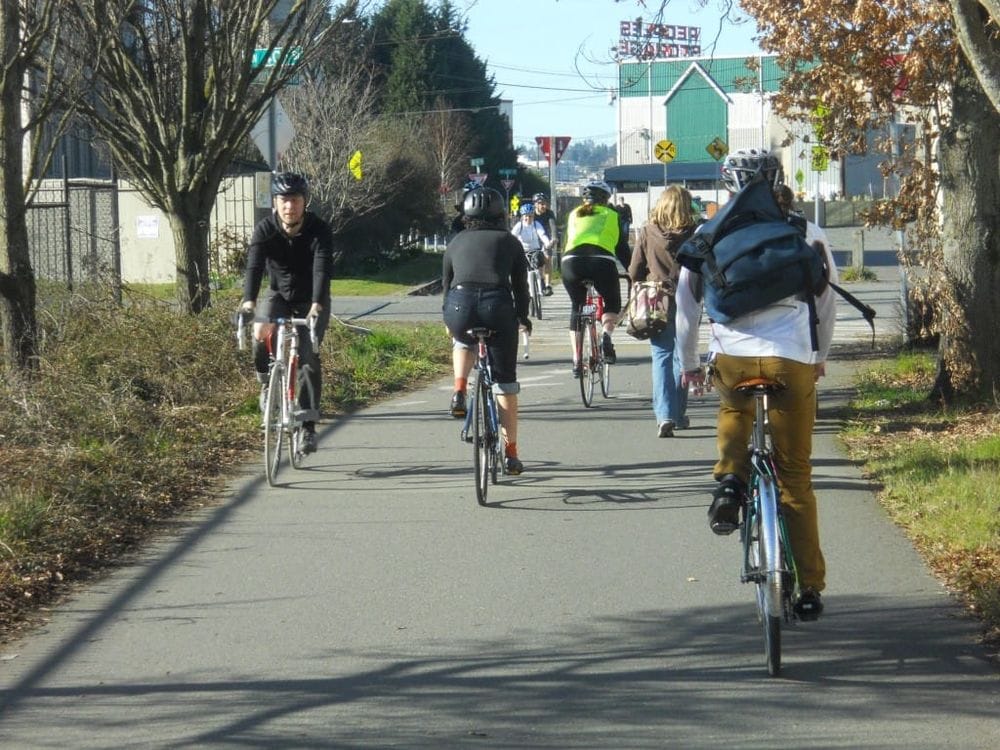
School bicycle access varied between both school and school level, but all schools were within a 15-minute bike ride of at least 60% of their district. On average, 78% of Bellevue School District high schools’ attendance areas were accessible within 15-minute cycle trips, with Interlake High School coming on top at 96%. For middle schools, the future site of Highland Middle School will be well-served for bike traffic; 85% of the school’s attendance area falls within a quarter-hour’s bike ride. Elementary schools are the most well-connected of all education levels. With their smaller attendance areas, at least 95% of each school’s attendance area is accessible within 15 minutes by a mode that’s kid-friendly, emissions-free, and effectively causes no damage to our roads. With so many important places in our city being so accessible to such a large proportion of our population, it begs the question: Why do we continue to prioritize infrastructure that makes it so hard to navigate our city without a car?

Where to Go From Here

This analysis returned much more information than I had originally intended on uncovering, but there are important limitations to consider. Essential to remember is that these findings represent a sort of “compromised solution”. Paris’s proposed commitment to the 15-minute city concept is accompanied with increased infill development and actual land use changes that shrink the geography of the city through the planning process. Although cycling is a great, energy-efficient mode of travel, it’s important to remember that it is not a viable option for many of our neighbors.

There is no substitute for improved density, zoning code revisions, and pedestrian infrastructure that makes spaces throughout our entire city more human-scale for people of all ages, races, and abilities. Additionally, I acknowledge that not all people who work and play in Bellevue are city residents for whom these short distance trips are a viable option, and our city’s high costs for housing play a large part in that dynamic. The best solutions to mitigate this problem will integrate regional collaborations with increased affordable housing options in our city, ensuring that people can live near where they spend their day-to-day lives. However, such changes can take months to plan and years to implement.  

It’s for this reason that I approached this analysis exclusively with cycling and transportation infrastructure in mind. Buildings are “rigid”–changes in land use code are accompanied by lengthy councilmember meetings, new construction inherently takes years to complete, and most development requires costly investments from private-sector entities. In contrast, this pandemic has shown us that our transportation infrastructure has the capacity to be quickly retooled to respond to a crisis.

Cities from all corners of the world (e.g., Bogotá, London, Berlin, Auckland, and many others) have chosen to mitigate the negative impacts of decreased transit ridership and increased automobile use by rapidly building out a low-cost, comprehensive network of beginner-friendly bikeways, and we can mirror their approaches here in Bellevue. We have major arterials like NE 8th St, Bel-Red Road, Bellevue Way, and Northup Way that provide direct, convenient connections to important commercial and employment centers, but only if you’re in a car. These roads have the right-of-way to spare for a couple of lanes to be reallocated from cars and opened for safe, socially distant bike and pedestrian use. 

In 2016, the city compiled a list of several quick improvements that could be made to our bike infrastructure. Above is their suggestion for Northup Way--certainly we can dream bigger than this? (City of Bellevue)
In 2016, the city compiled a list of several quick improvements that could be made to our bike infrastructure. Above is their suggestion for Northup Way–certainly we can dream bigger than this? (City of Bellevue)

Although it can be hard to imagine these roads as anything other than the noisy arterials they currently are, all we’re missing is the vision. Bellevue residents were smart to approve the Neighborhood Safety, Connectivity and Congestion Levy back in 2016, which provides funding for bicycle facilities and other transportation project improvements for the next 20 years via a small property tax (a more progressive and recession-proof mechanism than much of our region’s transit funding). This funding is already being used to make ambitious permanent changes to our city’s right-of-way allocation, but we can go one step further.

If we could use even a fraction of the annual $2 million of the levy funding that’s being allocated to reduce automobile congestion on our streets, we could pay for delineators, bollards, speed limit signs, and other cheap and quick-to-implement pieces of infrastructure that would make the biking experience that much safer and convenient in Bellevue. And it’s not like cyclists aren’t using these routes already–we know this because two of the three cyclist deaths in Bellevue in the last nine months have been on NE 8th St. We just have currently decided that we’re willing to accept these deaths and others like them for as long as we go without making key changes to our infrastructure. 

But the cities I cited earlier know that this is not good enough. They understand that transformations like the ones I propose here are essential to ensuring our cycling infrastructure feels safe to use for people of all ages and abilities, so that our workers can get back to work safely and greenly, so our communities can be connected to essential services even without an automobile, and so our elementary-school children can feel safe biking to their classes. We can be a city that achieves its own ambitious emissions reduction targets, one where the vision behind Vision Zero is realized and where we never see another ghost bike on our streets again. 

This vision can be our city’s new reality through quick, low-cost transformation–but only if our city council and leadership show the initiative. 

In the wake of Covid-19, there are people that are going to be calling for continued investment in the private automobile, cuts to transit infrastructure, and will think that investing in cycling infrastructure is ludicrous. They will present car infrastructure as the obvious solution, an inevitability even, while ignoring the significant, inequitable costs these vehicles bestow upon our residents and our future. What I want Bellevue residents and leaders to understand is that nothing is inevitable. Throughout our city’s history, we have chosen, like many cities and suburbs nationwide, to prioritize automobile travel at the cost of our pedestrian spaces and sense of place. We can make a different choice–and it isn’t as hard of a choice as it may seem. 

Author’s Note: The Analysis in Detail

There were several steps involved in compiling the data for this analysis together. To start, I used QGIS and city GIS data to calculate the center point of each of the city’s neighborhoods and notated its address or coordinates. These points served as starting locations from which I could draw polygons encompassing the areas accessible via a 15-minute bike ride. There are several tools available online to calculate such catchment areas based on a given travel time and mode, but I elected to use Travel Time because it’s an easy-to-use QGIS plugin that’s available for free noncommercial use. 

LAKE HILLS BIKEABLE AREA

Lake Hills is on the east side of Bellevue along Lake Sammamish. (Graphic by Christopher Randels)
Travel Time returns polygons like the one above, which is the area accessible within a 15 minute bike-ride from the center of Lake Hills neighborhood. (Graphic by author)

After the polygons were generated, I moved onto the next step: assembling addresses of various services and destinations in Bellevue. For this analysis, I chose to look at libraries, post offices, pharmacies, certain employment centers, grocery stores, and schools. By compiling comprehensive lists of each destination type and notating their addresses, I could count how many businesses fall within a neighborhood’s bikeable polygon and thus assess the neighborhood’s level of access to that service by bicycle. 

For libraries and post offices, I used the King County Public Library and US Post Office websites, respectively, to gather addresses for all locations in Bellevue and surrounding areas. I obtained grocery store addresses from the Center on Budget and Policy Priorities’s database of retailers that accept SNAP benefits. This dataset includes places like gas station convenience stores and bakeries, so I narrowed my list down to include only super stores, supermarkets, grocery stores, and combination groceries (i.e., locations that could serve most of a family’s grocery needs) within Bellevue and its environs. Although my list of pharmacies was not comprehensive (there are a lot more independent pharmacies in Bellevue than I realized), I used all Bellevue and surrounding area pharmacy locations from the following retailers: Bartell Drugs, CVS, Fred Meyer, QFC, Rite Aid, Safeway, Target, Walgreens, and Walmart. 

Although it is difficult in this simple analysis to quantify the number of employers available in a given catchment area, I elected to use access to certain major regional employers as a stand-in metric instead. The employers chosen (T-Mobile USA, HTC, Expedia Group, Microsoft Redmond, future REI headquarters, and Overlake Hospital) also represent different geographical areas of Bellevue (Factoria, Eastgate, Downtown, NE Bellevue/SW Redmond, Bel-Red, and Wilburton, respectively); access to these destinations can thus also serve as an approximation of access to other employers nearby. 

In contrast to the other measured destinations, use of certain schools is not exclusively determined by physical distance and personal choice, but rather often stipulated by school district boundaries. To account for this, I elected to use Bellevue School District public schools as the starting points for the 15-minute bikeable polygons rather than the centers of neighborhoods. Once those school-based polygons were drawn, I could then determine the percentage of the school’s attendance area that was within a 15-minute bike ride. For simplicity, I chose to only analyze Bellevue School District, which includes some municipalities outside Bellevue (e.g., Medina and Clyde Hill) and does not entirely include some Bellevue neighborhoods (e.g., Cougar Mountain/Lakemont). Although this represents a different analytical method than the one I used for other destinations, I believe this still serves as a good, comparable metric for Bellevue residents’ school access via bicycle.

Article Author

Chris is a UW Environmental Sciences graduate who moved to Bellevue in 2015. When he's not busy being an urbanist fox on the internet, he's working on the Eastside to support efforts reducing greenhouse gas emissions and going to city council meetings to denounce the hegemony of automobile infrastructure. Follow him on Twitter at @Deutski1.