108th Avenue protected bike lane in Bellevue. (Photo by Chris Randels)

Although Seattle, the economic and cultural hub of our region, rightfully receives ample scrutiny for its commitment to a greener, more equitable mobility system, it is important not to forget the similar responsibilities borne by our region’s other cities. In my previous article, I provided a vision for what transformative, paradigm-shifting change could look like for Bellevue’s transportation system. Although historically an auto-dominated city, our leaders could use lessons from other cities around the world and repurpose road space on key arterials to be used for safe, socially-distant walking, biking, and transit use instead. I was happily surprised that the expected “bikelash” was heavily outweighed by positive comments from urbanists, organizations, and community members alike who appreciated the future-oriented perspective for a city traditionally not associated with green mobility. 

As an urbanist myself, I find it easy to get lost in such grand, top-down visions of how things could be different, and I think that such theorizing ultimately serves a positive purpose–it enables people of all political realities to stop and consider substantial changes to the status quo. However, I feel it’s also important to acknowledge the enormous political will such transformations can require, political will that is often not available in suburban towns with several conservative councilmembers. Therefore, it’s essential that advocates not lose sight of the visionary goals we have for our cities while also focusing on the concrete improvements that need to be made to our non-automobile infrastructure.

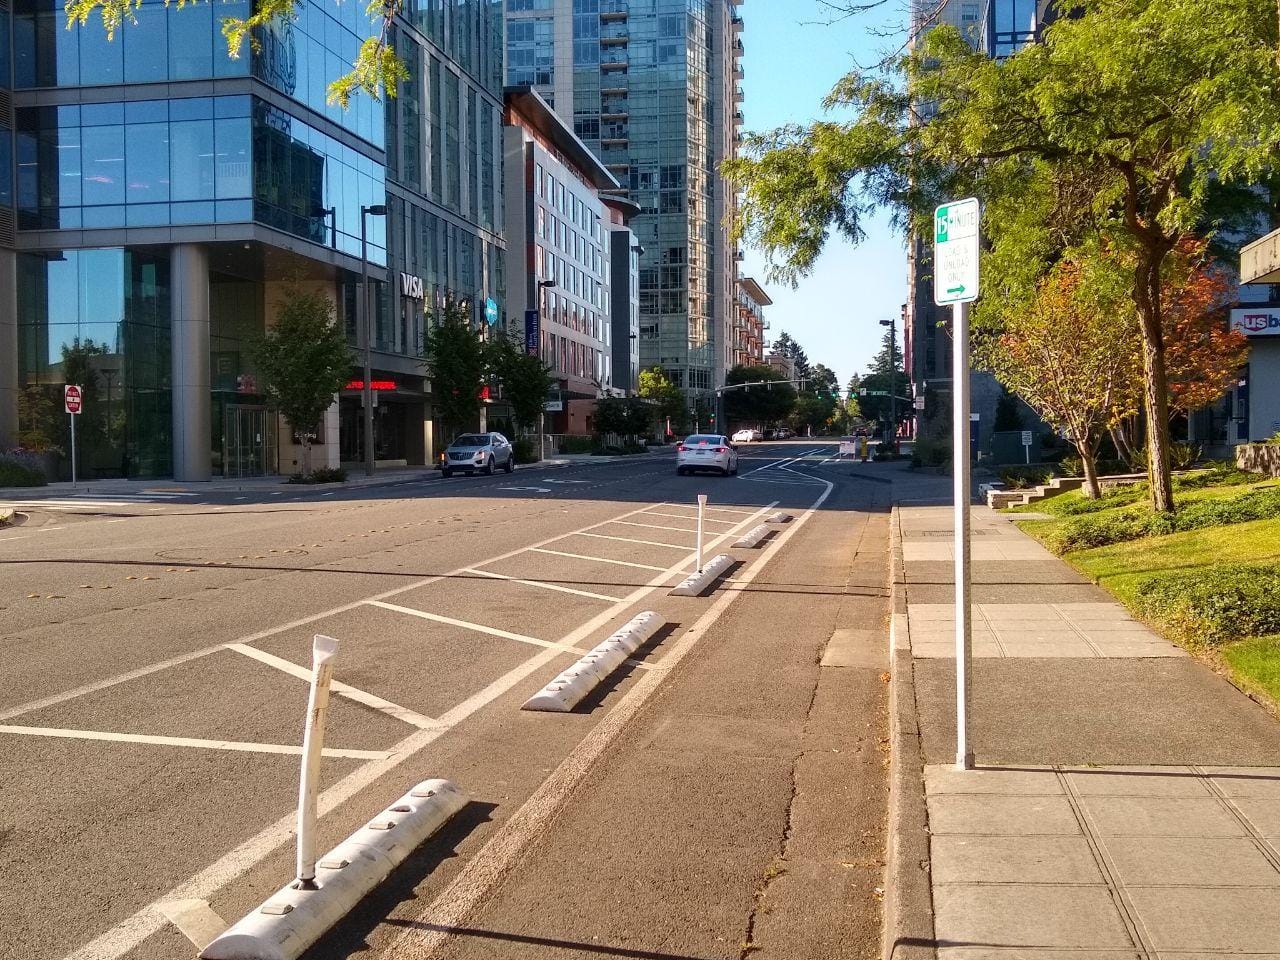
And in Bellevue, there is substantial room for some concrete improvements due to the significant absence of separated, protected bicycle facilities (there’s a rimshot there that’ll make sense by the end of this article). Although some newer facilities are prioritizing separation and distance from cars, there are certainly plenty of examples of unprotected, narrow, and outright uninviting bicycle lanes that do little to ensure the safety of current riders or entice the new ones we need to meet our climate targets. These types of facilities cater only to a limited percentage of potential cyclists because of the higher-speed automobile traffic directly next to them. Can you imagine the (rightful) uproar if we used public money to engineer city roads that only 10% of drivers felt comfortable driving on?

Bike riders of all persuasions already know that painted lanes are not enough to ensure their safety–I and other cyclists I’ve talked with can relay numerous anecdotes of drivers dangerously speeding past us as we feel the whip of their wind bristle on our arms. But being the scientist I am, I wanted to confirm this quantitatively, and in doing so underscore our obligation to make our city’s bicycle facilities truly accessible for All Ages, Languages, Ethnicities, Genders, Races, and Abilities (ALEGRA)

  • Left: Bellevue Bicycle Corridor map with study points marked in red. (Bellevue DOT) Right: Strava heat map for Bellevue. 140th Ave is an important corridor for people who walk, bike, and roll in central Bellevue. (Strava)
  • Left: Looking north on 145th Pl towards the study point. (Google Streetview) Right: A closer look of the median, curve, and bicycle facilities on both sides of the street. For the majority of people who do not feel comfortable cycling next to motor vehicles unprotected, the sidewalk is currently the only safe option. (Google StreetView)
  • Left: 140th Ave looking northward as one approaches Main Street. (Google Streetview) Right: Looking South on 140th Ave from Main Street. Note the nearly two car lengths of space from the crosswalk to where the curb starts to curve to accommodate turning drivers. (Google Streetview)

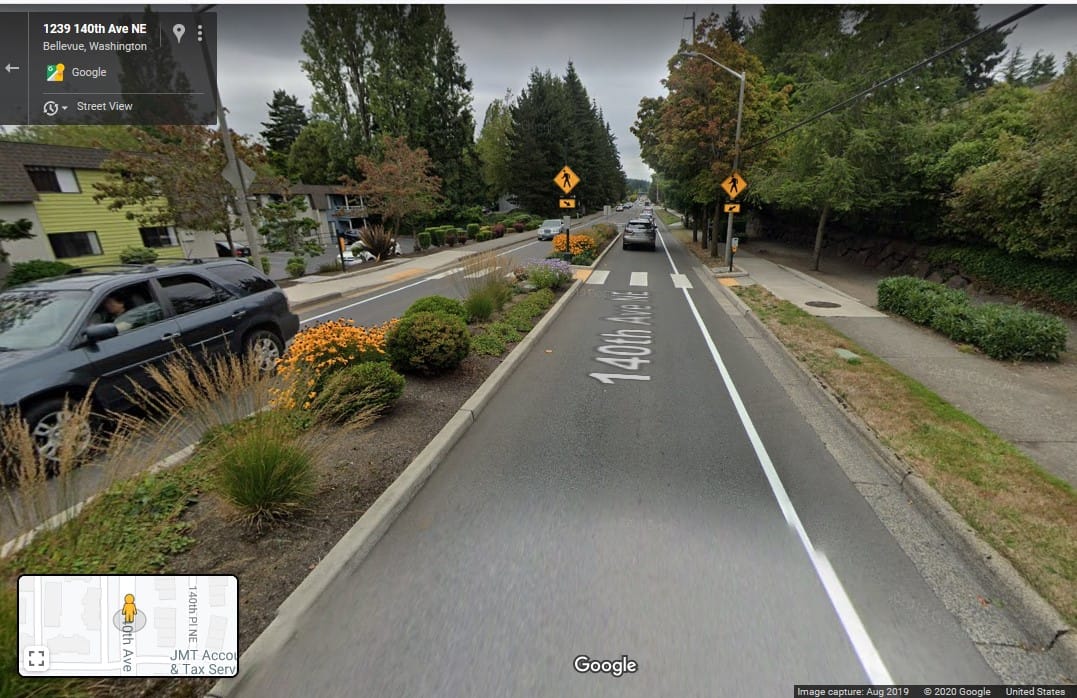
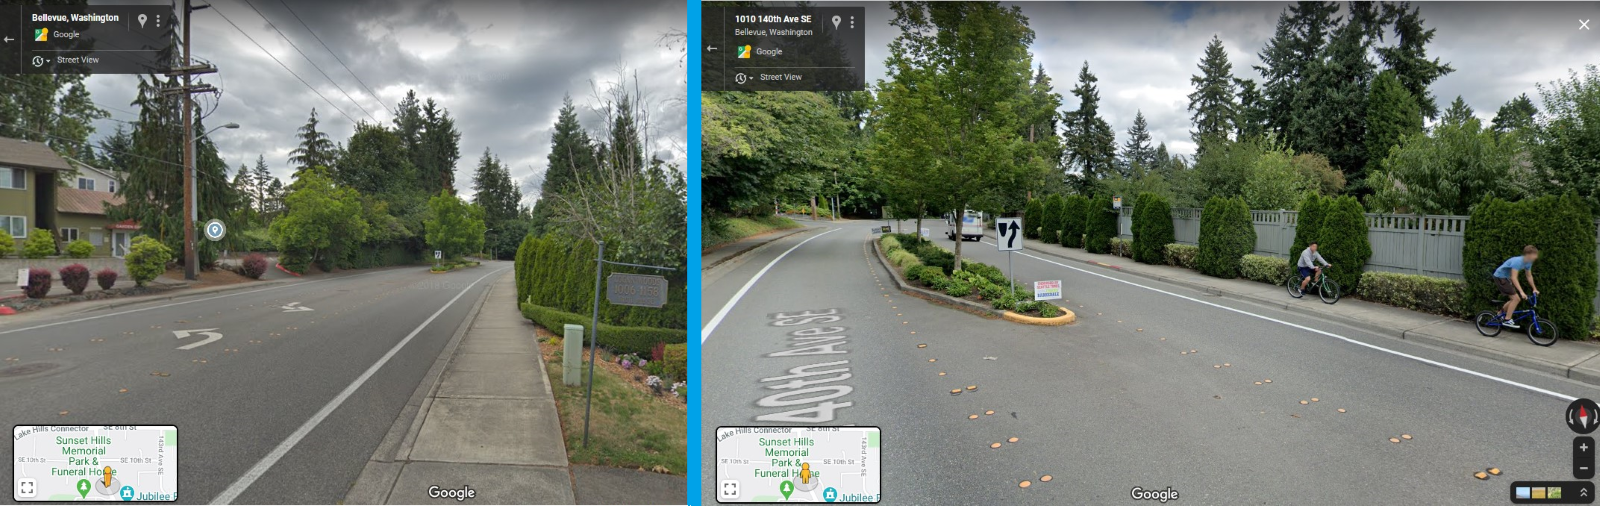
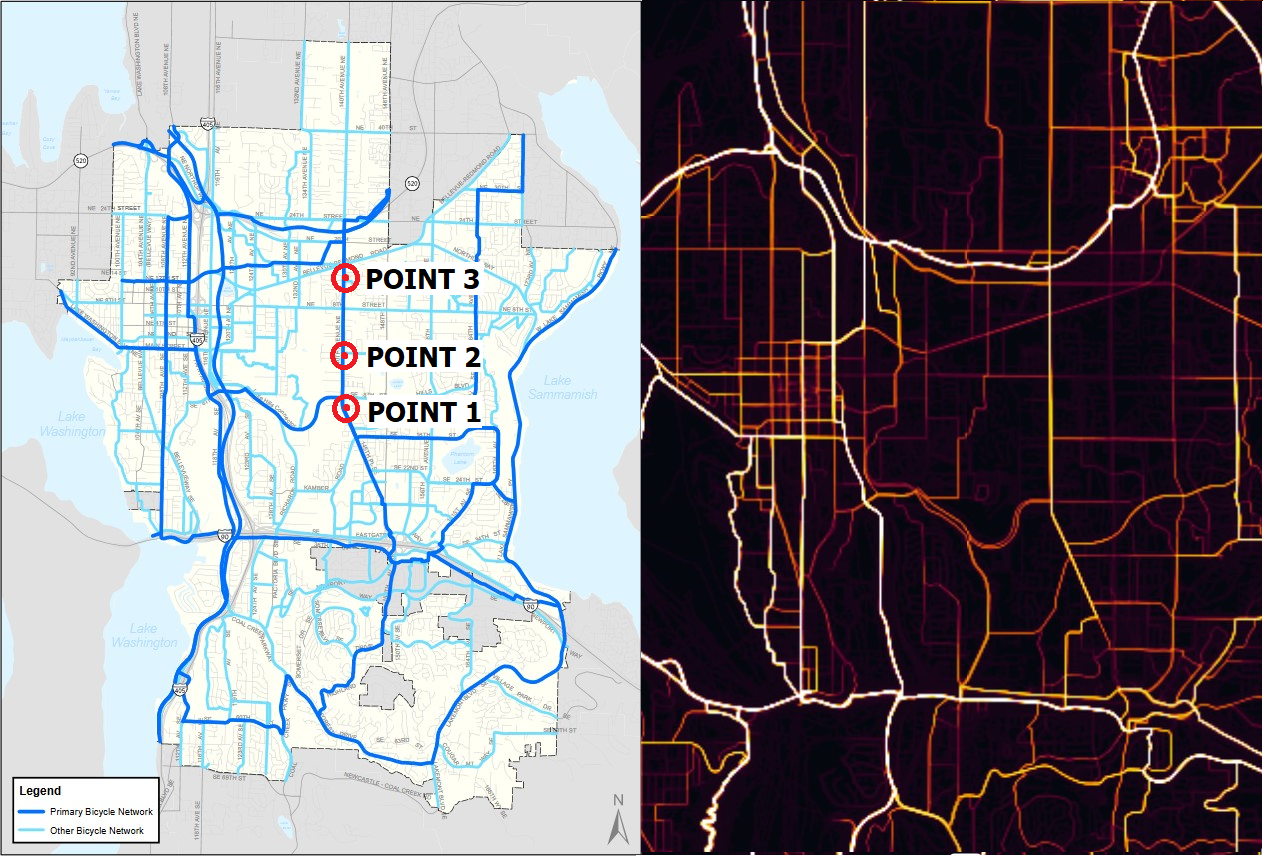
To do so, I selected three sites on 140th Ave, a frequently-used cyclist corridor in east Bellevue. Although there are painted, intentional bicycle lanes along nearly the entire corridor, there are no buffers, barriers, or other mechanisms to ensure cyclist separation and protection from drivers. I therefore assessed driver behavior at the above three points by noting how far (if at all) they crossed over the paint line demarcating vehicle and bicycle separation. Points 1 and 3 (see above map) represented a curved and straight point, respectively, where road width is constricted by a median, so I measured how many feet drivers were away from the paint line as their vehicles passed.

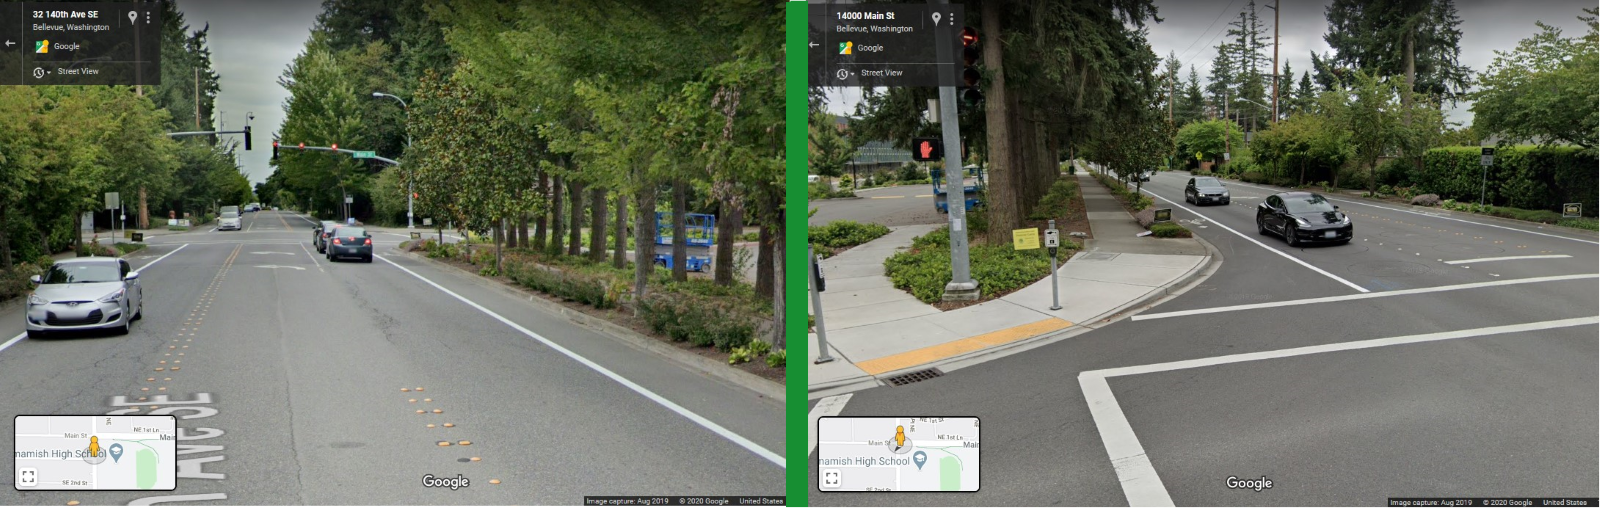
At Point 1 in particular, the northbound bike facilities fall on the inner edge of the curve, so I have often observed drivers that will cut into the facilities to make the turn more tightly and thus maintain their speed. Similarly, Point 2 represents an intersection with a large corner radius, which enables drivers to more easily maintain their speed as they turn if they cut into the bike lane to do so. Here, I measured how far behind the intersection vehicles crossed into the bike lane as they conducted their right turn. For more detailed site descriptions and methods, please read the Author’s Note at the end of the article.

How Drivers Did

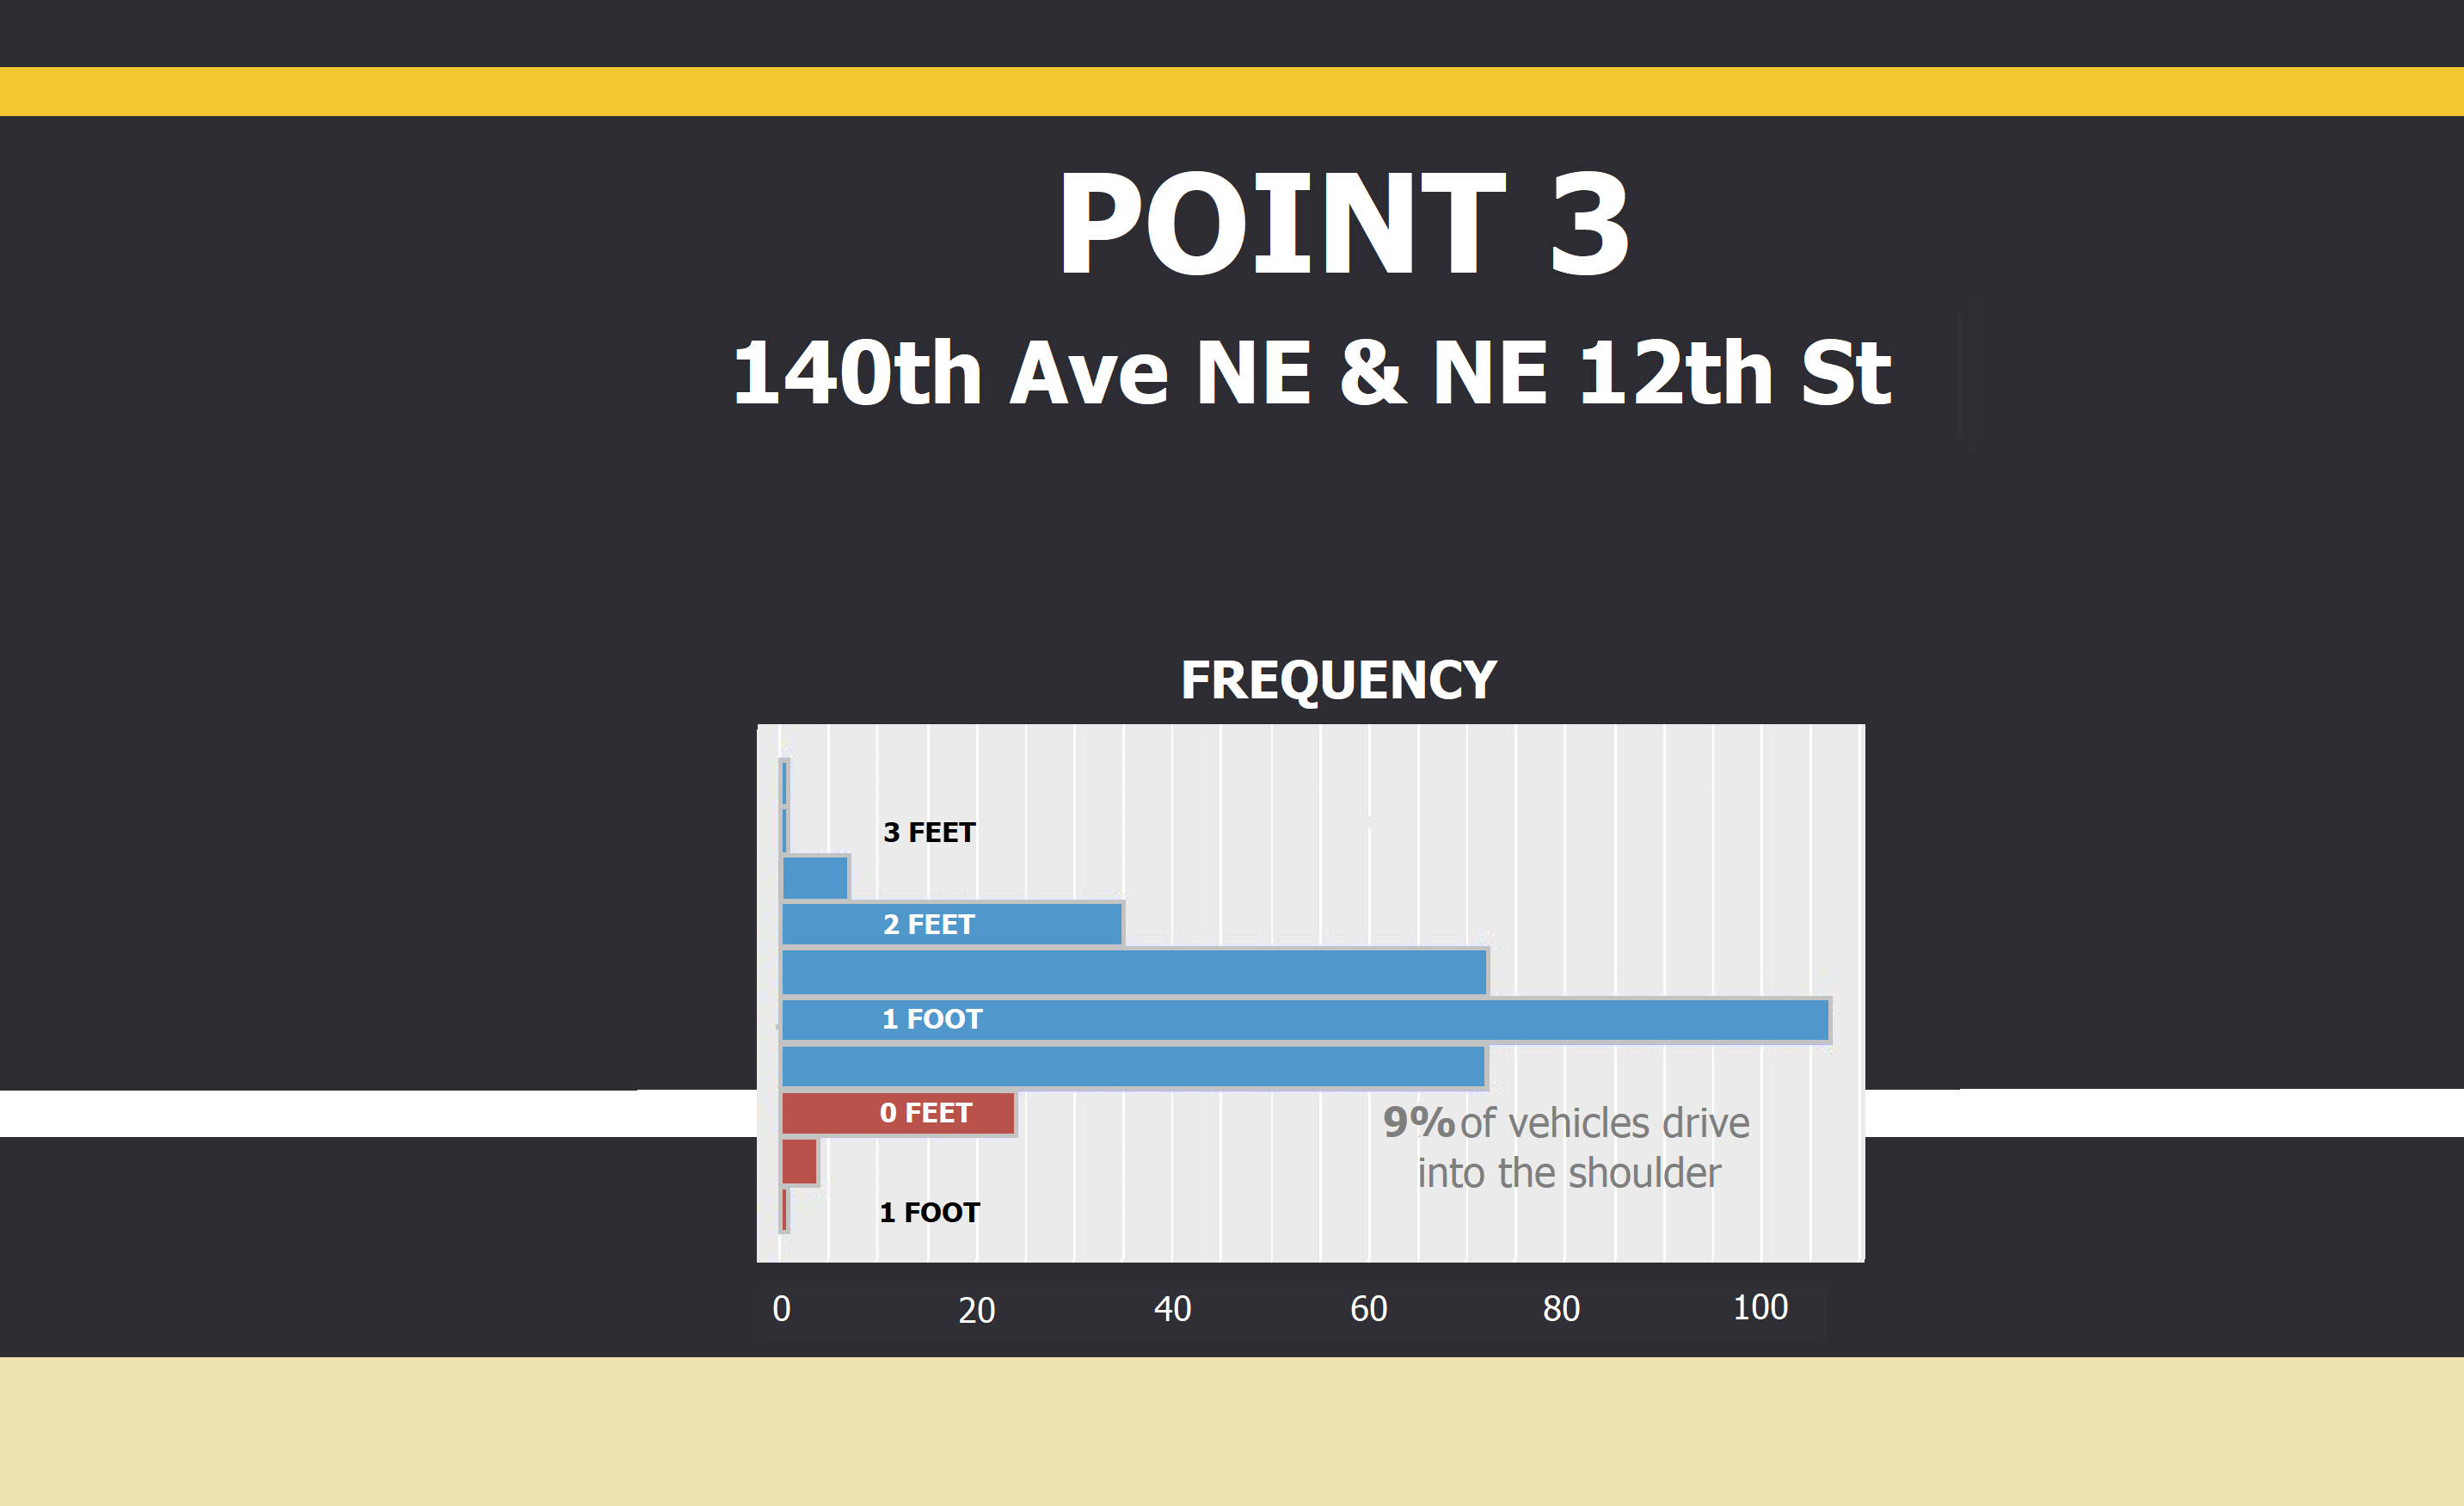
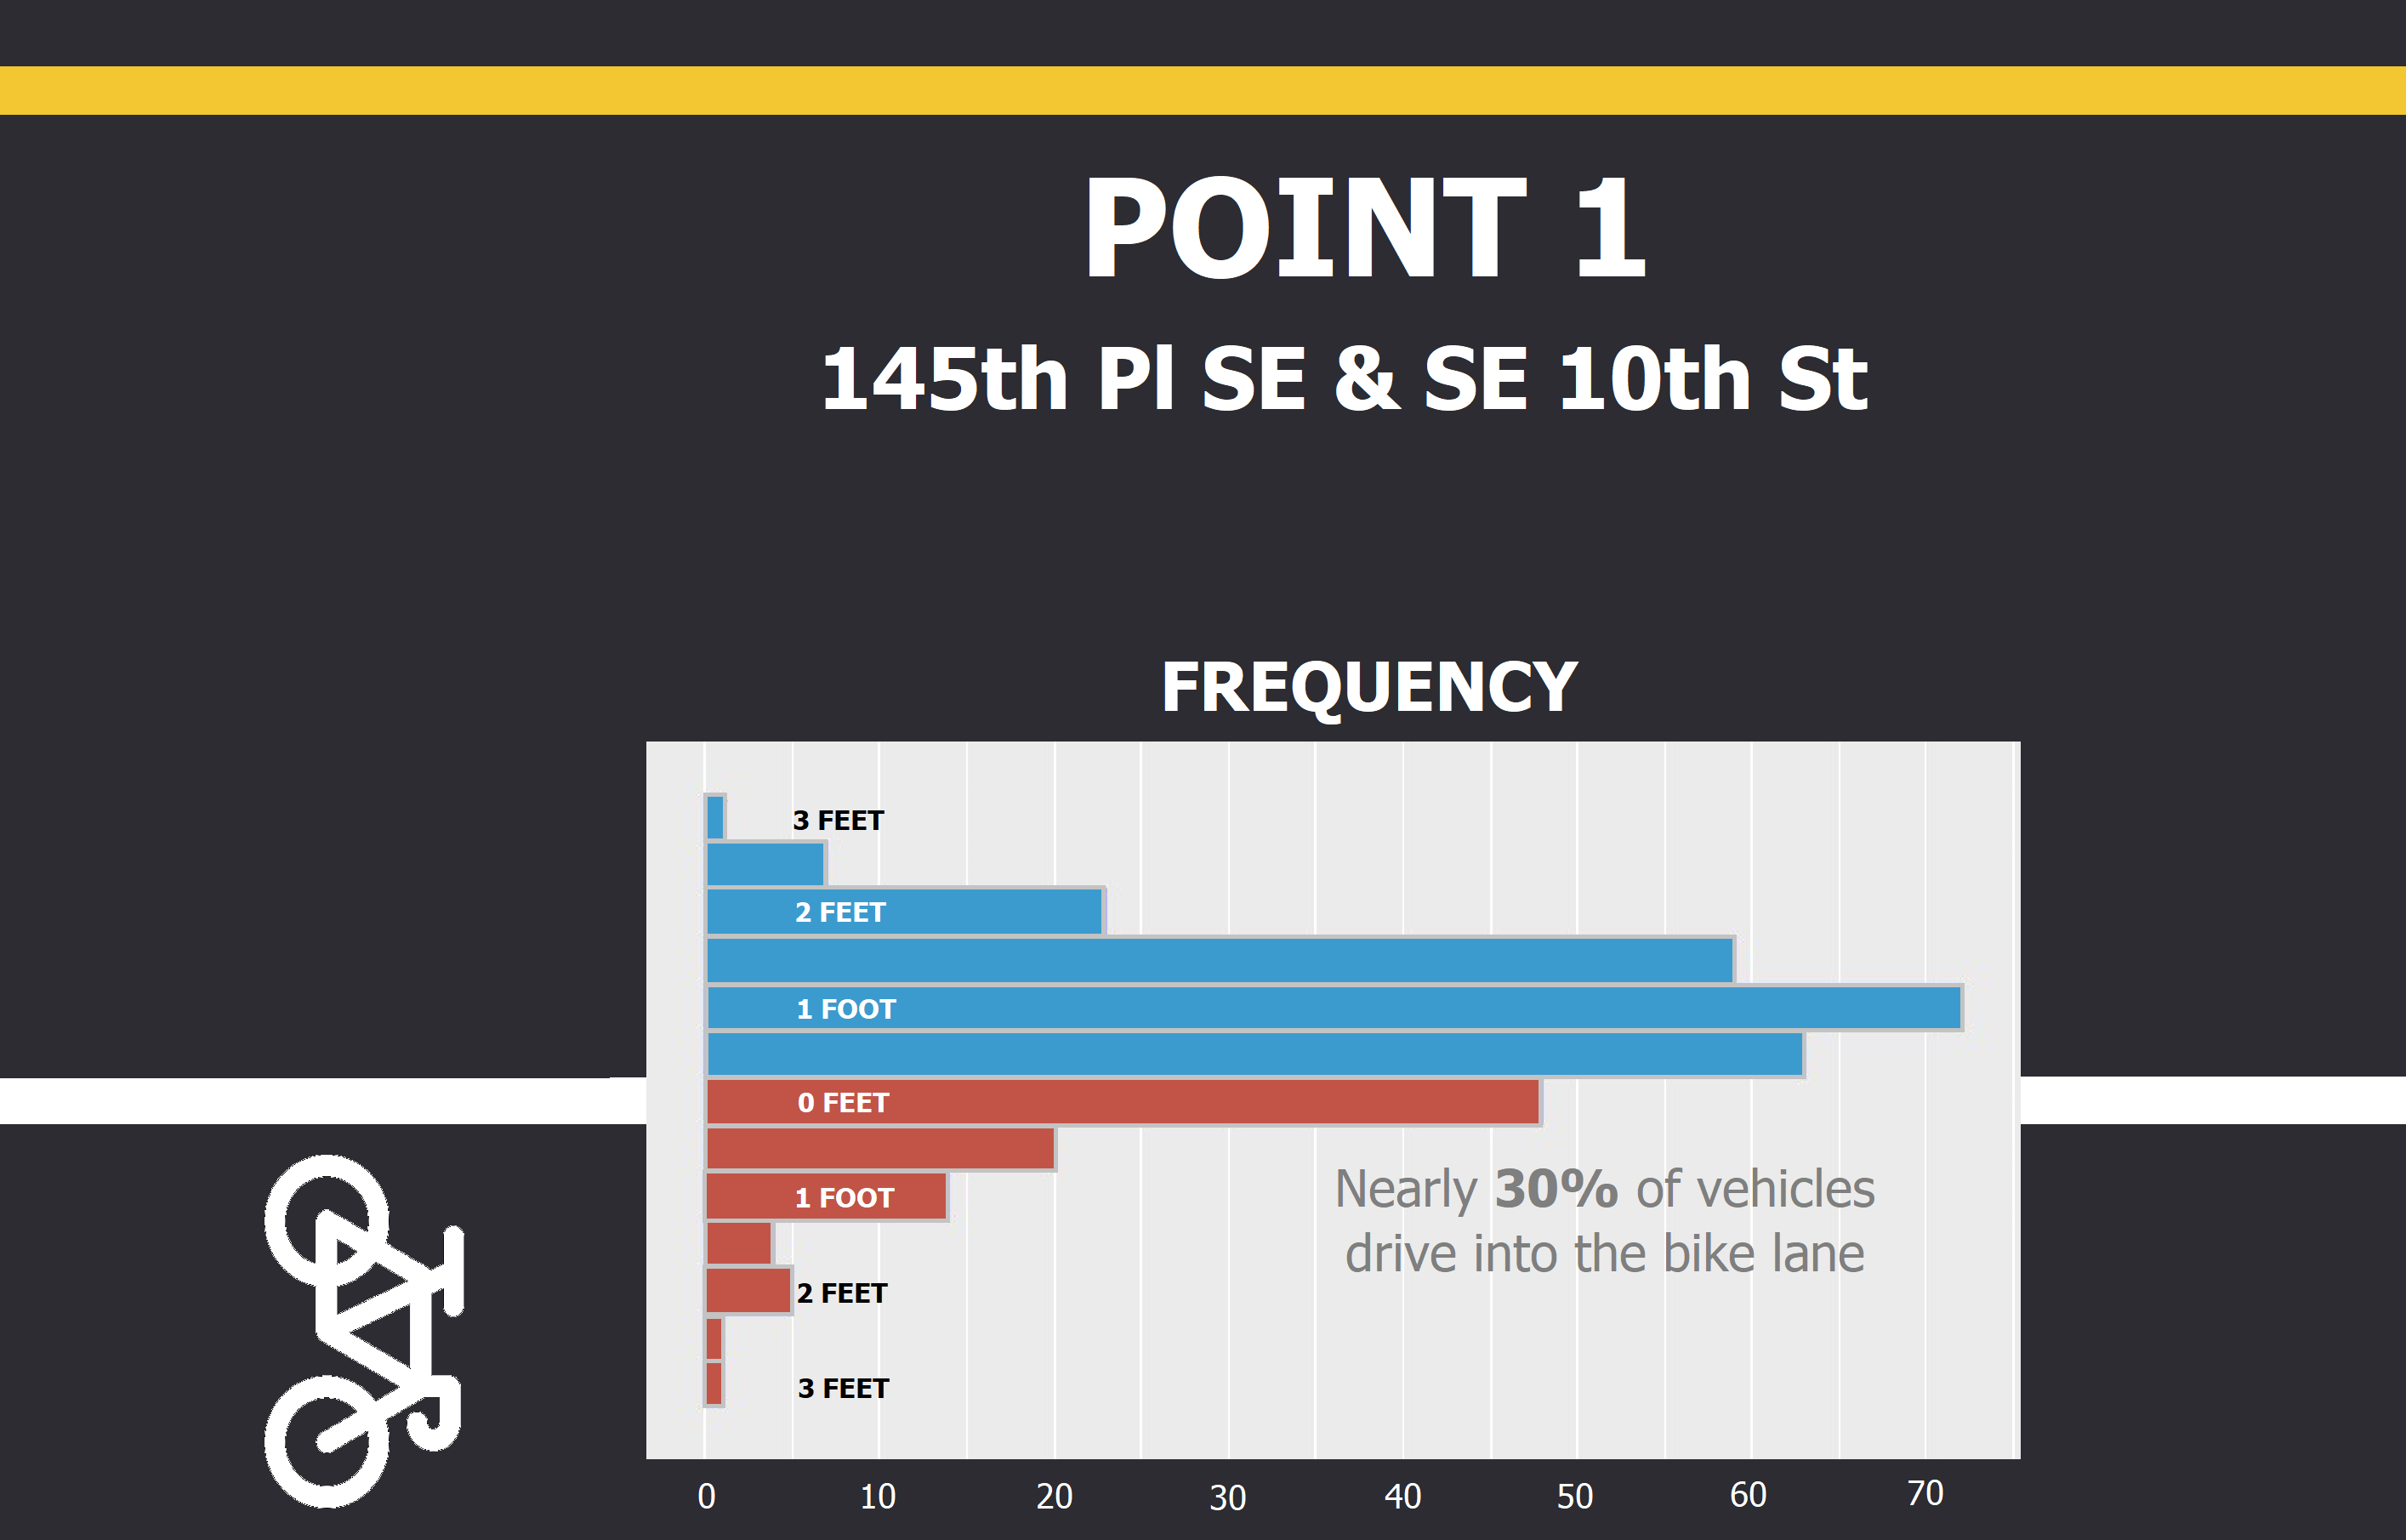
At Points 1 and 3, more than 300 vehicles passed by each site during an hour’s worth of data collection, and there were indeed marked differences in how far away drivers were from bicycle facilities as they passed. On average, drivers at Point 1 were less than 7 inches away from the bike lane, in contrast to the full foot (13 inches actually) of distance allotted on the straight road. This data was enough to show that cars do pass significantly closer to cycle lanes on curved roads than straight ones (p < 0.0001, for those that care about p-values). Although those six inches may sound minimal, it’s important to also look at the data’s distribution to understand the whole story.

As seen in the figures above, drivers passing one foot away from the lane comprised the largest category at both points, but significantly more drivers went onto or into the bicycle facilities at Point 1. This further emphasizes that drivers are not hesitant to behave in a way that maximizes their speed and mobility while potentially sacrificing the safety of people on bikes. Also note that the facilities at Point 3 are half a foot narrower than those at Point 1; therefore, if bike riders are the same distance from the curb at both points, a vehicle separation of 1 foot at Point 3 is only equivalent to a separation of 0.5 feet at Point 1. This illustrates the necessity of a comprehensive view of both lane widths and the facilities present to best understand cyclist safety.

Histogram of how many cars crossed into the bike lane while completing a right turn. Horizontal and vertical distances are to scale.
Histogram of how many cars crossed into the bike lane while completing a right turn. Horizontal and vertical distances are to scale. (Graphic by author)

Even more egregious was the driver behavior I observed at Point 2, where I measured how far back cars would cross into a bike lane to make a right turn. Across the 65 vehicles I observed, drivers entered bike facilities an average of 21 feet behind the crosswalk. One driver even entered the lane almost 40 feet before the intersection, and, as detailed in the Author’s Note, most vehicles actually entered at a point that exceeded my ability to accurately measure. It should be noted that it’s not as if it is presently impossible for vehicles to complete the curve without prematurely crossing into the bike lane. Although it was a motorcyclist who crossed the paint line 3 feet behind the intersection and thus represented the “best” in driver behavior, the other vehicles who had values less than 10 feet were all normal SUVs and sedans. In fact, a student driver correctly pulled up to the intersection, slowed down, and only crossed the bike lane 6 feet from the crosswalk after they had confirmed there were no cyclists behind them. This suggests motorists have the innate ability to understand the rules of the road, be aware of their surroundings, and drive around curves more responsibly–but they may sometimes forget to take such care after they’ve passed theirdriver’s tests.

But why have we designed our roads in a way where the only thing ensuring drivers show that care is a line of paint on the ground?

Why all this matters

Perhaps the most glaring limitation of these results is that, except for a few times where a cyclist actually was present while a car drove by, they do not capture actual behavior as drivers pass a cyclist. However, in a city that has committed to a Vision Zero pledge of zero traffic deaths on its streets by 2030, a city whose councilmembers unanimously backed a systems-oriented approach to Vision Zero, I do not believe that matters. Fundamental to the idea of Vision Zero is that “to err is human,” and people make mistakes. Drivers can be distracted for even a second and run over pedestrians in a marked crosswalk. Drivers can be blinded by the sun as they make a left turn on an early summer morning and collide with a cyclist. Drivers can fail to move over for cyclists and then make the malicious choice to continue on their way after a collision.

The key to actually seeing zero annual deaths on our roads by 2030 isn’t to rely on education and correcting human behavior–it’s to design our street networks in ways that make it impossible for such deaths to occur in spite of human behavior. By this logic, the takeaway from this data isn’t that most drivers are bad and their behavior needs to be corrected–it’s that there is a problem in the way this street is designed, and we need to change it to ensure that this behavior cannot occur. 

But what can those design changes look like given limited road space? As menial and dull as it may sound, a great first step is to comprehensively examine road widths in Bellevue. Although not the case for 140th Ave (more detail in the Author’s Note), the default lane width for new public roads in Bellevue is 12 feet, and road widths in many areas of the city actually reach 14 feet or greater. This is far off from the NACTO-recommended width of 10 feet for motor vehicle lanes. In addition to naturally reducing vehicle speeds by encouraging more cautious driving, reallocating road space for non-motorized uses, even just a couple of feet, can provide space for facilities that can actually protect and separate cyclists from motor vehicle traffic, like concrete. 

Told you that rimshot would make sense.

It’s important to acknowledge that there are actually many options for physical separations between cyclists and drivers, and they each carry their own advantages. For example, Bellevue elected to use white flex posts embedded in plastic curbs at several spots on 108th Ave NE when the facilities were constructed in 2018. Since the lanes were originally intended as a trial pilot project, using flex posts allowed planners to cheaply implement meaningful changes that could be readily moved or reconfigured based on community feedback. Similarly, the pop-up bikeways being implemented around the world often use plastic posts or caution cones to demarcate facilities not only because they are inexpensive, but because they can be easily reconfigured if planners or community members later realize the facilities aren’t working as intended. However, ideally these posts should not be used for long-term bike facilities because eventually drivers will realize they are the same as paint–they can just be driven over

This is why for long-term facilities, I believe concrete and other permanent, rigid barriers are the best alternative. 140th Ave has been designated a priority cycling corridor since the city’s 2009 Pedestrian and Bicycling Plan, and it will remain an essential bicycle thoroughfare for Bellevue residents in Lake Hills, Crossroads, Bel-Red, and other populous neighborhoods. Providing actual protection for these facilities shows that the city is making serious investments in the safety of all road users, and that message gets seen loud and clear by drivers who may be interested in switching to cycling, but currently don’t feel safe because they see 30% of cars regularly going into painted bike lanes! 

Given the context, large barriers wouldn’t even be required: with lower speeds, decorated walls like the ones pictured above can provide cheap and effective protection while giving community members a chance to show artistic flair and contribute to a neighborhood’s character. With the right combination of community feedback, right of way reallocation, and acknowledgement of transit users’ needs, many places where currently only painted bike lanes exist could be modified to include actual, meaningful protection. 

Granted, not every location will be able to accommodate the same cookie-cutter solutions. For example, the right-of-way at Point 3 currently appears to be too narrow to reallocate space from automobiles without dismantling the median or removing a lane (one can dream…). Additionally, detractors may scoff at the added expense meaningful protection brings, especially with limited budgets in the time of Covid-19. However, as I mentioned in my previous article, our city presently has no problems spending $2 million every year to study the implementation of road widenings in the name of “decreasing congestion” (even on key bicycle corridors!).

he city commissioned a study for widening 140th Ave at NE 8th Street, a project that would cost $1.6 million. Although this project has not moved forward, that such widening projects are even being considered in a climate crisis is concerning. (Concord Engineering
The city commissioned a study for widening 140th Ave at NE 8th Street, a project that would cost $1.6 million. Although this project has not moved forward, that such widening projects are even being considered in a climate crisis is concerning. (Concord Engineering)

If we have the money to even consider widening roads for cars in spite of the long-term, locked-in carbon costs that such projects will bring, why can’t we even consider the widening of the road for bike facilities? At a bare minimum, shouldn’t we get creative on solutions that can allocate more space for the safe, protected, ALEGRA facilities our city desperately needs?

Back in the beforetimes (when public meetings were still meetings in public), I attended the Bellevue City Council meeting where councilmembers unanimously approved the strategic, systems-oriented framework behind Vision Zero. Mayor Lynne Robinson praised transportation staff and expressed her excitement in going “all out” for the Safe Systems approach:

“I think there’s only one thing that’s more dangerous than not having a Vision Zero program and that’s having a partially implemented one. When we start to implement this, I hope we go full force and get it fully implemented as soon as possible.”

Flashing forward to yesterday: City Council met virtually on Monday, July 27th at 6pm to receive public feedback regarding community priorities as the city creates the upcoming biennium budget. Currently, staff is forecasting an expected 8% reduction in expenditures as a result of Covid-19, including reductions to the Capital Investment Plan. Although the Neighborhood Infrastructure Levy has been the primary monetary source for new cycling facilities, the CIP still provides critical funding for key non-motorized infrastructure improvements. The rapid, “full implementation” of Vision Zero that the mayor envisions will require (metaphorical and literal) concrete improvements that rely on adequate funding. Ultimately, any challenges we face, any barriers we feel there are to actually making our streets safer–they are solvable problems if we make it a fiscal and policy priority to solve them

And the solution won’t be more cheap lines of paint on the ground. 


AUTHOR’S NOTE: Site Descriptions & Data Collection

To compare configurations given the same basic road conditions and traffic volume, I selected three points on the 140th Ave bike corridor — Point 1 145th Pl SE & SE 10th St, Point 2 140th Ave SE & Main St, and Point 3 140th Ave NE & 12th St. This key north-south bikeway connects residents to Bellevue College, Sammamish High School, the Lake to Lake Trail, doctors’ offices, grocery stores, and other important businesses, so ensuring that users have safe facilities along the whole corridor should be a high priority for Bellevue’s DOT. In the late evening of July 14th, my partner and I went out to each site to measure lane widths and make the required chalk markings. Data was collected the following afternoon – my partner and I split up to cover Points 1 & 3 from 1:10 pm to 2:10 pm, then we both collected data from Point 2 between 2:30 pm and 3:30 pm. Posted speed limits are 30 mph along the entire corridor, from Bellevue College in the south to when the road becomes a five lane arterial between Bel-Red Rd and NE 24th St. Lane widths and general site descriptions are included below. 

145th Pl SE & SE 10th St

At this juncture where 145th Pl turns into 140th Ave, road users veer slightly northward along a gradual rightward turn next to a vegetated median. Although aesthetically pleasing, this median constrains available space for vehicles and seems to have necessitated a narrowing of the bike lane to accommodate. Although a full five feet just 100 feet before the turn, the bike lane at this point is only 4.5 feet wide. The automobile lane is approximately 10.5 feet wide, as measured from the raised pavement markers approximately six inches away from the median. 

The markings we had made the previous evening had substantially faded in half a day’s time, but they were still visible enough in the field to use them for data collection. Each hash mark represents 6 inches from the center of the painted line. (Photo by Author)
The chalk markings we had made the previous evening had substantially faded in half a day’s time, but they were still visible enough in the field to use them for data collection. Each hash mark represents 6 inches from the center of the painted line. (Photo by Author)

Because there is no physical barrier present, automobiles will often drift into the bike lane in order to maintain their speed as they complete the turn. By choosing this point, I wanted to gather concrete quantitative data showing just how significantly cars drift into the bicycle facilities (and how often). To do so, I marked chalk lines parallel to the painted white line at six inch intervals in both directions. As cars drove by, I noted which line the car’s tires passed over and recorded that value. I felt that notating the tire location was the easiest and most consistent metric to measure, but note that car mirrors can extend several inches away from a car’s body and pose a risk to cyclists even if the vehicle is otherwise in its own lane (another reason for more protected facilities).

140th Ave SE & Main St

This intersection lies northwest of Sammamish High School and provides a connection to Main Street for both cyclists and motorists. However, a wide curb radius currently enables motor vehicles to turn right onto Main Street while more easily maintaining their speed, and drivers will frequently enter the bicycle lane well before the intersection to do so. The motor vehicle lane is already narrow at 10 feet and there is enough room for a 5 foot wide bike lane, but cars still frequently drive above the posted 30 mph speed limit and complete this turn as quickly as possible. 

These markings had luckily not faded as much as those at Point 1, but based on the data I observed, it’s possible any lines I would have drawn beyond 20 feet would have been barely visible. (Photo by Author)

To measure how far behind the intersection turning cars began to enter the bike lane, I drew perpendicular hash marks at one foot intervals from the edge of the crosswalk extending back 19 feet (see picture above) and noted the point at which the rear tires of right-turning vehicles crossed into the bike lane. As I began collecting data, I quickly realized that I had underestimated just how far back cars will begin to move rightward for the turn. Because of traffic conditions preventing me from making additional markings, I elected to use environmental clues, such as parallel 5’ sidewalk panels, to serve as distance estimates. All observed cars entering the bike lane 20 feet behind the crosswalk or greater were demarcated in my datasheet as “estimated values”, but I believe all observations to be accurate +/- 2 feet. They certainly serve as good enough approximations to determine overall trends – that motor vehicles cross into cyclist territory significantly earlier than they should. 

140th Ave NE & NE 12th St

From NE 8th St to NE 14th St (about 0.4 miles), the bike lane turns into a narrow (4’) painted shoulder that frightens cyclists of all skill levels. While traversing northbound and going downhill, the relative pace one can keep with motor vehicle traffic adds some sense of security; however, the slower southbound trek uphill while vehicles whoosh past you is not for the faint of heart. Additionally, nearly 40% of this shoulder (1.5 feet) is actually just curbspace, leaving only 2.5 feet for asphalt. Although manageable on a big-wheeled vehicle like a bicycle, the difference in surface heights makes travelling in this “lane” on a smaller-wheeled vehicle (e.g. scooter, skateboard, etc.) dangerous. Automobile lane width is a relatively narrow 10.5 feet at the point of study, as measured to the vegetated median. 

Data collection and line demarcation proceeded the same here as for Point 1. Prior to this study, I had anecdotally observed a significant difference in vehicle drift between straight and curved roads, so this point was explicitly chosen as a companion to Point 1 in order to test that hypothesis. 

Data

As I knew not all motor vehicles passing by would be normal automobiles or trucks, I made some additional notes during data collection about whether the recorded vehicle was a motorcycle or (because Points 1 and 2 were along King County Metro transit routes) a bus. As acknowledged earlier, motor vehicles will also behave differently when they see that a cyclist is present, so I also noted if a cyclist was nearby when a data point was collected. I have uploaded all raw data to my Google Drive, so feel free to peruse and analyze as you please!

Article Author

Chris is a UW Environmental Sciences graduate who moved to Bellevue in 2015. When he's not busy being an urbanist fox on the internet, he's working on the Eastside to support efforts reducing greenhouse gas emissions and going to city council meetings to denounce the hegemony of automobile infrastructure. Follow him on Twitter at @Deutski1.