Given the Emerald City’s reputation for progressive environmental politics, it may come as no surprise to many people that Seattle was recently ranked seventh greenest city US in a recent report by WalletHub, a personal finance website. Seattle has been generally ahead of the curve, after all, when it comes to embracing environmental policies, such as banning plastic bags or embracing municipal composting of food waste. The importance of environmental sustainability is also a frequent refrain in both local political rhetoric and private sector marketing.
But is Seattle really as green as a top ten national ranking suggests? A closer inspection of the WalletHub report, and what its data reveals about Seattle, shows it all depends on what one considers “green” to be.
In creating the report, the researchers for WalletHub took into consideration 28 different metrics, each of which was assigned a point value. Those values were then combined and weighted into scores grouped into four overarching categories that included lifestyle and policy, environment, transportation, and energy sources. A score of “one” was considered to be best, while a score of 50 was considered to be average. Anything above 50 was substandard, meaning that the 100 score in environment awarded to Glendale, AZ, represents a very bleak result.

Seattle’s scores in the four general categories fell across a fairly wide distribution. The city was middling in environment (47) and much stronger in transportation (11) and energy (12). But where Seattle truly stood out from the pack was lifestyle and policy, for which the city received the distinguished score of two. Only Portland, San Francisco, and a few other smaller California cities managed to receive comparable scores in this category.
But this is where the very idea of what it means to be “green” begins to come into question. While WalletHub did not provide full data on Seattle’s scores for the 28 metrics, it did share a few notable data points, some of which lay bare uncomfortable truths.
“Greenness” of Seattle (1=Best; 50=Avg.):
43 — Greenhouse-Gas Emissions per Capita
34 — Percentage of Green Space
20 — Median Air Quality Index
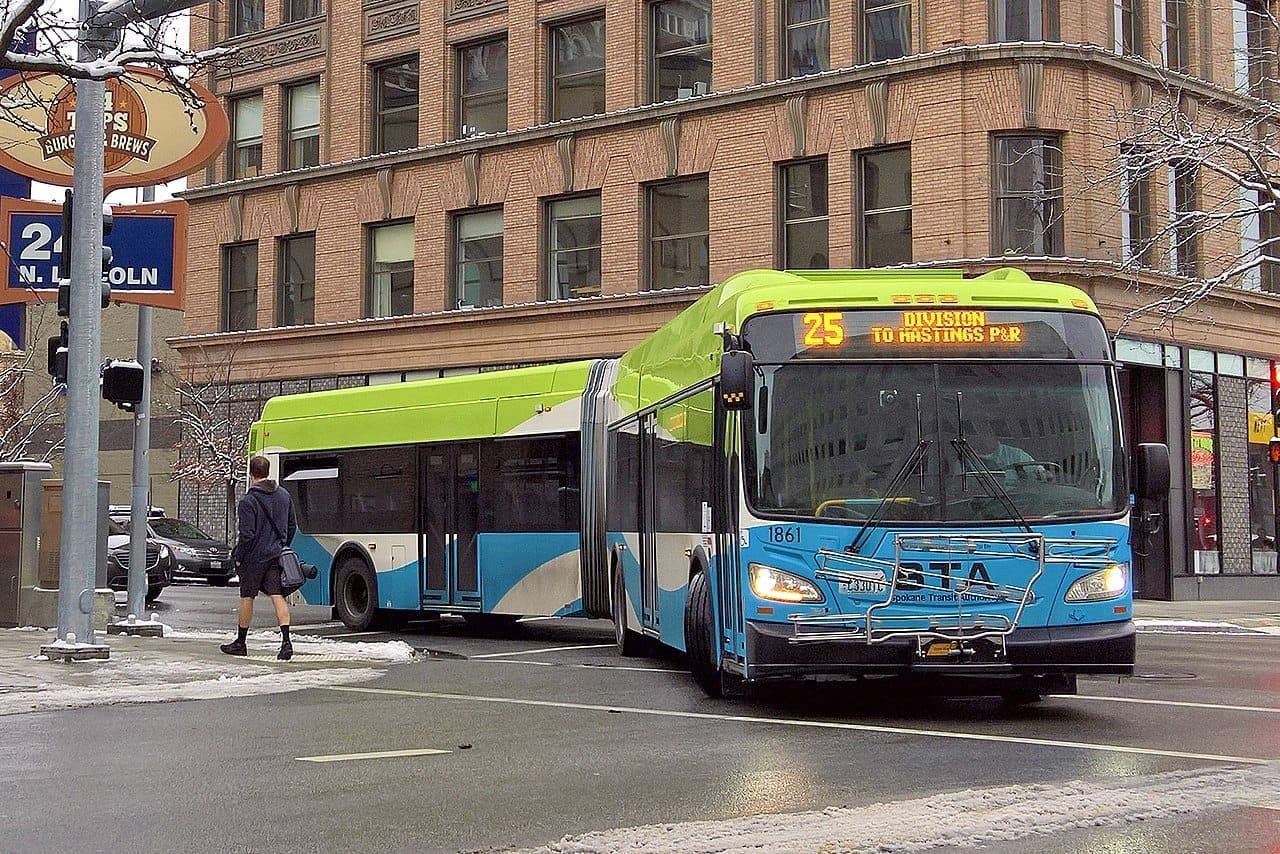
6 — Percentage of Commuters Who Drive
11 — Walk Score
11 — Farmers Markets per Capita
According to this data snapshot, Seattle may be a great place to go shopping at a farmer’s market, but it’s not performing so well on greenhouse gas emissions, a metric that reveals harder evidence about a city’s environmental impact.

Additionally, while the score for the percentage of commuters who drive was exceptional, that could very well be because in a post-Covid world, Seattle’s commuting patterns have truly diverged from the national norm: Census data from 2019-2022 showed 46.8% of Seattleites identified as working remotely, ranking the city second in the country for remote workers behind only Washington, DC. But the Census data also showed that driving alone was the second most common mode of commuting for Seattleites, with 142,271 people responding that they drove alone to work. By contrast, walking landed as a distant third with 29,927 respondents.
It’s important to point out that Seattle does not stand alone in this trend. A report from the Brookings Institute shows that despite having the second highest amount of transit riders per capita in the country, Washington D.C. also has a stubbornly high number of commuters who continue to drive alone to work.
But what does it mean to be a city with a fairly average environmental score and an exceptional lifestyle and policy score? Well, in the case of the environment, it means that Seattle’s scores in areas like urban heat island effect, air and water quality index, population density, green space, and water consumption all amounted to a score that was close to the report average.
WalletHub did not provide a complete breakdown for each metric, so there were likely differences between the scores they received and a lot of valuable information could be extracted from those differences. The report also had its quirks too. For instance, a city’s share of green hotels was factored into the environment category — even though hotels are known for bearing a heavy environmental footprint, it felt strange to see that held on par with a metric like urban heat island effect.
In addition to farmers markets and community supported agriculture (CSA) per capita, additional “lifestyle and policy” metrics like the number of certified organic farms and community garden plots per capita, “green” job opportunities, local programs promoting green energy use, and the presence of plastic bags were all factored in.
That might be why Portland, which ranked as second greenest city overall in the WalletHub report, was the only city to receive the top score for lifestyle and policy. Like Seattle, Portland is known for it’s community agriculture and “eco-friendly” culture.
But there are other ways to measure what it means for a city to be green, and in at least another 2022 report on green cities, both Portland and Seattle fared much poorer.
In a report released by LawnStarter, Portland landed at 20th place and Seattle at 22nd, while the top slots were occupied by San Francisco, Rochester, and New York City. There were similarities in criteria between the two reports, but notable differences were present as well. Lawnstarter, for example, included the tons of landfill waste per 100,000 residents, a factor which was not taken into consideration in WalletHub’s report. And while it may be surprising to see Rochester near the top of their list, that’s because the city’s ambitious policies on greenhouse gas reductions are actually producing results. According to the data compiled by Lawnstarter, Rochester was the strongest in the nation in this regard.
So is Seattle really one of the greenest US cities? It appears that is a question that can be answered in different ways depending on how one defines what it means to be green. This year San Diego landed the number one spot on the WalletHub report, even though it received a score of 29 for transportation because strong showings in the environment and energy categories made up for the fact that San Diego is not exactly known for the quality of its public transportation network.
But can a city be declared “greenest” in the country while still being best traveled by car? At the very least, that’s a claim many people would find questionable.
To Meet Housing and Sustainability Goals, Seattle Must Streamline Land Use Code