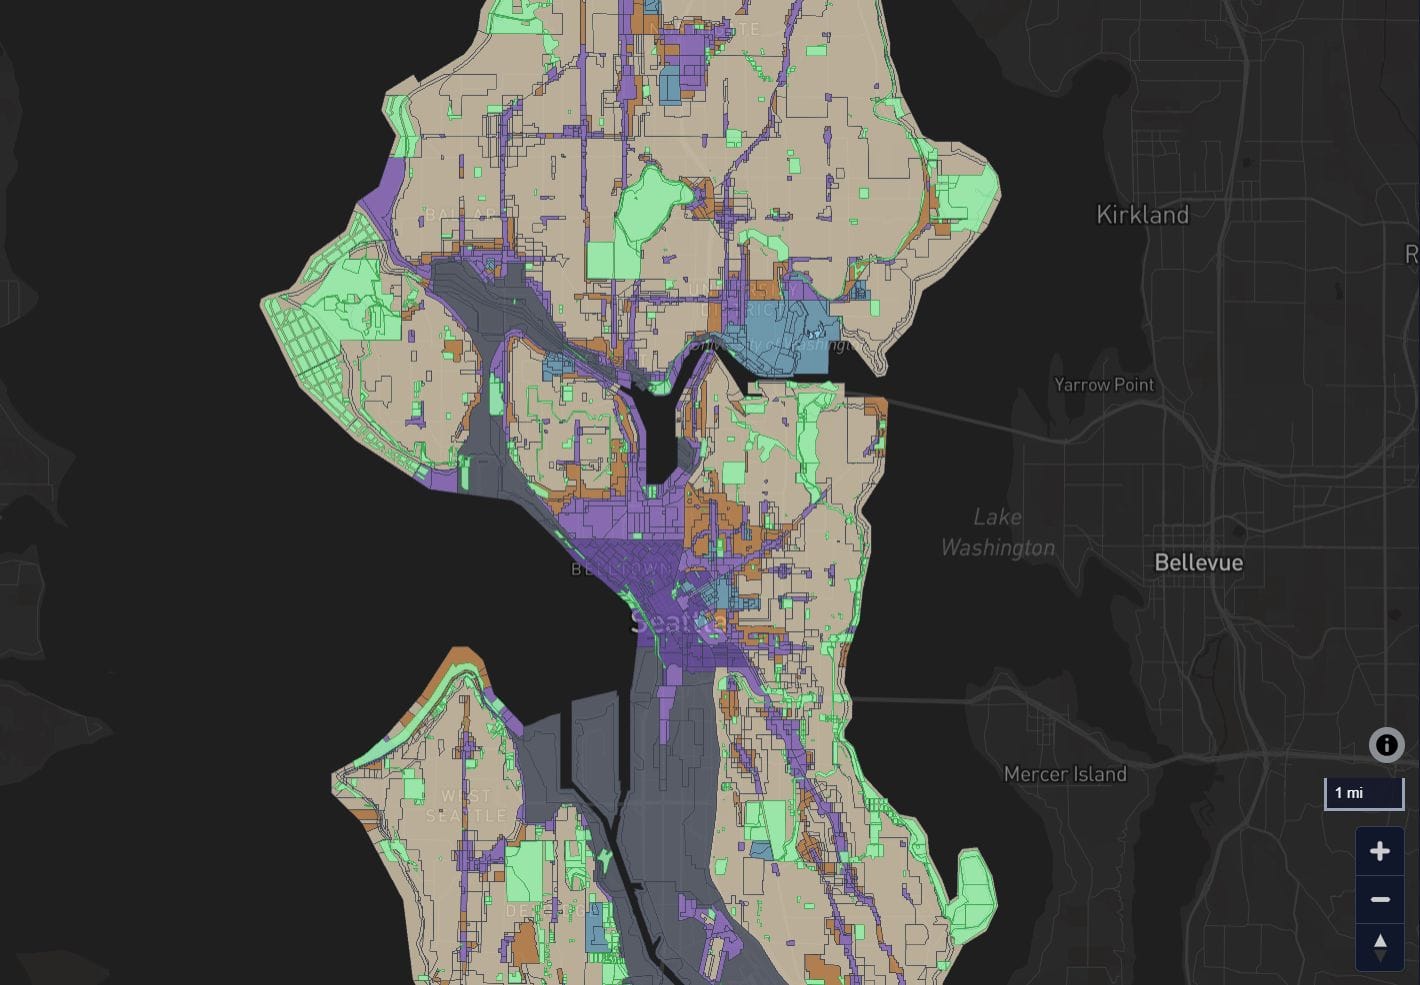
One of the main points made by the anti-movement in the lead up to last year’s vote on a Seattle-specific transportation levy, the nine-year Levy to Move Seattle, was the idea that promises had been made to Seattle voters in the previous transportation levy (Bridging the Gap) had not been fulfilled. The Seattle Department of Transportation (SDOT) appears to be responding to complaints about lack of transparency by beefing up its performance metrics reporting. Directly from the SDOT website is now the most visible example that Seattle residents will be able to access for the duration of the levy: the Move Seattle Dashboard. when announcing his budget plan on Monday, Mayor Ed Murray specifically called out this dashboard in touting transparency across all departments.
The dashboard includes 12 top-level measurements for success, with some metrics having other subordinate metrics for users to delve into as well. The 12 metrics are separated into three categories: Safe Routes, Congestion Relief, and Maintenance and Repair.
Move Seattle goals are on a timeline for completion by December of 2024, but a number of the metrics have differing timelines depending on other City programs and goals. Here are the goals for the span of the levy in each category.
Safe Routes
Eliminate Serious and Fatal Collisions by 2030 (Vision Zero). The dashboard uses a rolling five-year average of all serious and fatal collisions for all modes. Today the number is 176, but the dashboard starts its baseline in 2008 with 257. Currently, we are higher than the trend line indicates we need to be at, so this is the only Move Seattle metric currently showing as yellow, meaning near target but not on target. The subcategories for this metric are:
- Complete 12-15 corridor safety projects. This was SDOT Director Scott Kubly’s answer to the question of what are the next steps for Vision Zero after a reduction of speed limits in the Center City and on neighborhood arterials, in addition to Safe Routes to Schools (below). The current number listed as completed is 2, but the Dashboard itself does not allow the user to see what those two corridor projects were.
- Maintain and improve the City’s system of traffic signals, signs, and markings. Currently at 83.5 miles completed.
- Increase crosswalk repainting frequency.
Increase Safe Routes to Schools (SRTS): A goal of 81 schools with a safe route to school project funded by the levy by December 2024. The levy also requires completing SRTS projects at 12 high priority schools within three years.
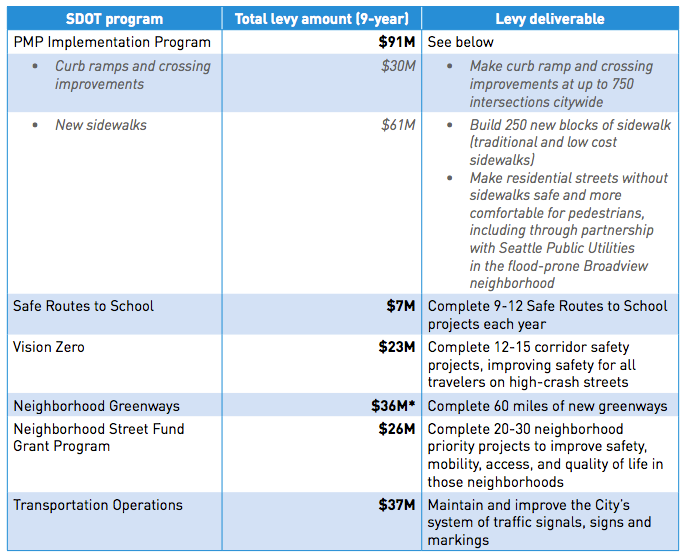
Prioritize pedestrians. The main metric here is a very basic one: increasing the percentage of city arterials that have sidewalks. This is where the Priority Investment Network (PIN) that is so integral to the Pedestrian Master Plan comes in. As was clear from that document, completing sidewalks in the PIN would require approximately double the amount of money proposed to be spent by the Move Seattle levy. Therefore the 100% goal is set to be accomplished by the end of 2034. This amounts to 250 blocks of new sidewalks that Move Seattle is expected to accomplish on its own. Right now Seattle stands at 93% of arterials in the PIN with sidewalks.
The chart below breaks out pedestrian spending from Move Seattle, from the Pedestrian Master Plan.
The other metrics by which the levy gauges the prioritization of pedestrians are:
- Repairing 225 blocks of existing sidewalks.
- Increase the frequency of repainting crosswalks (which was also a Vision Zero metric).
- Make curb ramp and crossing improvements at 750 intersections citywide.
Fund neighborhood projects. This is an interesting metric in that it’s the only one that that is solely dependent on the amount of money spent: $26 million. No other performance metrics for the projects selected by the Oversight Board is indicated. These projects are the Neighborhood Street Fund (NSF) projects, which are currently filtering through the Neighborhood District Councils (for perhaps the last time) and will be decided by the board in October. The three-year cycle of these projects around $1 million in cost is what accounts for the $26 million total levy amount.
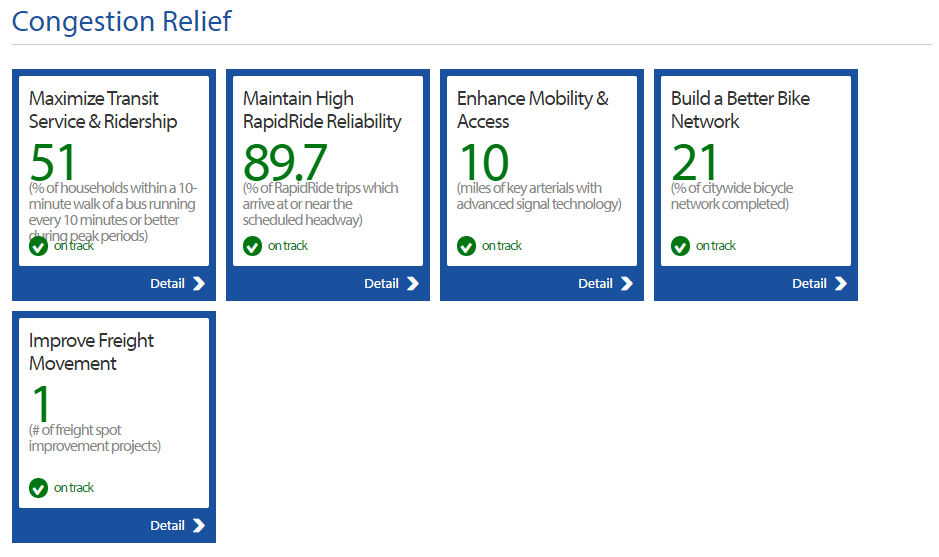
Congestion Relief
Maximize Transit Service and Ridership. The goal for Move Seattle is to increase the number of households within a 10-minute walk of a bus running 10 minutes or better during peak periods from its current 51% to 72% by December 2024. While bus service hours are in Metro’s purview and Seattle’s Proposition 1 is on a ticking clock, the Move Seattle component is the corridor upgrades which are planned through the life of the levy. Presumably these capital improvements will speed buses up enough to allow service hours to be more effectively spread across the city. Of course, this metric is only for peak periods.
The subordinate goals here are:
- Create seven RapidRide+ transit corridors, as mentioned above.
- 11 transit spot improvements (once we find out what one of those looks like, we will let you know).
Maintain High RapidRide Reliability. This Move Seattle goal is an on-time performance (OTP) target of 80% or better on RapidRide routes. Currently OTP is at 89.7% overall with the lowest being 87.8% on RapidRide E. It seems like the bar could be set higher here as we begin to invest in growing the RapidRide network with higher quality corridor improvements.
Implement Advanced Signal Technology. 45 miles of key arterials are proposed to get upgrades to their signal timing. We wrote about how Denny Way will be getting a grant via the Puget Sound Regional Council to get just that. The levy also intends to:
- Optimize traffic signal timing on five corridors throughout the city.
- Maintain and improve the city’s system of traffic signals, signs, and markings.
- Perform major maintenance on the City’s traffic signals.
- Install new signals to improve traffic flow.
Build a Better Bike Network. Build 50% of a citywide bike network by December 2024. According to the dashboard, the figure currently sits at 21%. The issue of the quality of the bike network, the connectivity, and the ages and abilities rating of the facilities will certainly be a contentious one.
Improve Freight Movement. Move Seattle will implement fout freight movement spot improvements in its lifespan. We’ve already knocked one out. When we find out what that was, we’ll let you know.
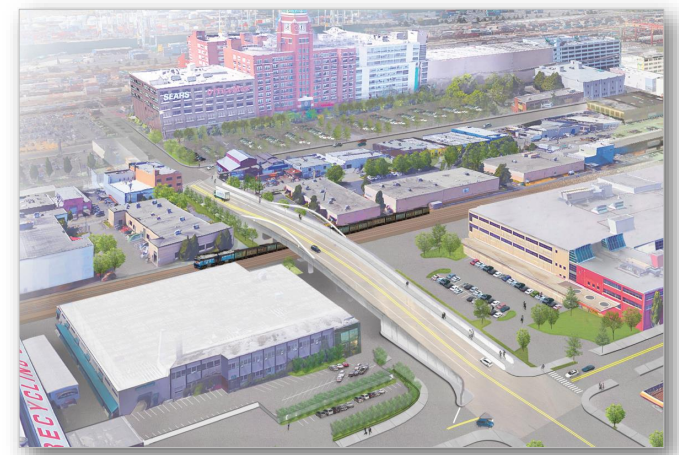
One of those four projects, however, is going to take a $20 million chunk of Move Seattle funds: the S Lander Street overpass that will cost a total of $140 and would use real estate excise taxes, Pacific Place garage money, and the largest federal grant ever awarded to the state of Washington.
Maintenance and Repair
Repave Key Arterial Streets. Move Seattle has a goal of increasing by 11% the amount of miles travelled by vehicle on pavement that is rated fair or better. This metric is worded in a way that suggests that Seattle as a whole is not attempting to reduce the number of vehicle miles traveled on its streets overall.
To contrast with this, SDOT does not currently have an up to date inventory on the current rating of sidewalks in Seattle, so it would not be possible to gauge a corresponding metric for miles traveled on sidewalks.
Subdivisions of this metric include:
- Repaving up to 180 lane-miles of arterial streets.
- Spot improvements on another 70 lane-miles of arterials.
- 65 targeted spot repairs.
Keep Our Bridges Safe. Seismic retrofitting of all “high priority” bridges. There is no specific number for the goal, simply 100% of those “high priority” bridges which certainly will include the Fairview Ave N bridge, the only remaining timber bridge in the city currently carrying traffic.
- Complete spot repair on bridges (we’ve already completed a stunning 182 spot repairs in less than a year of Levy operation).
- Seismically reinforce 16 vulnerable bridges.
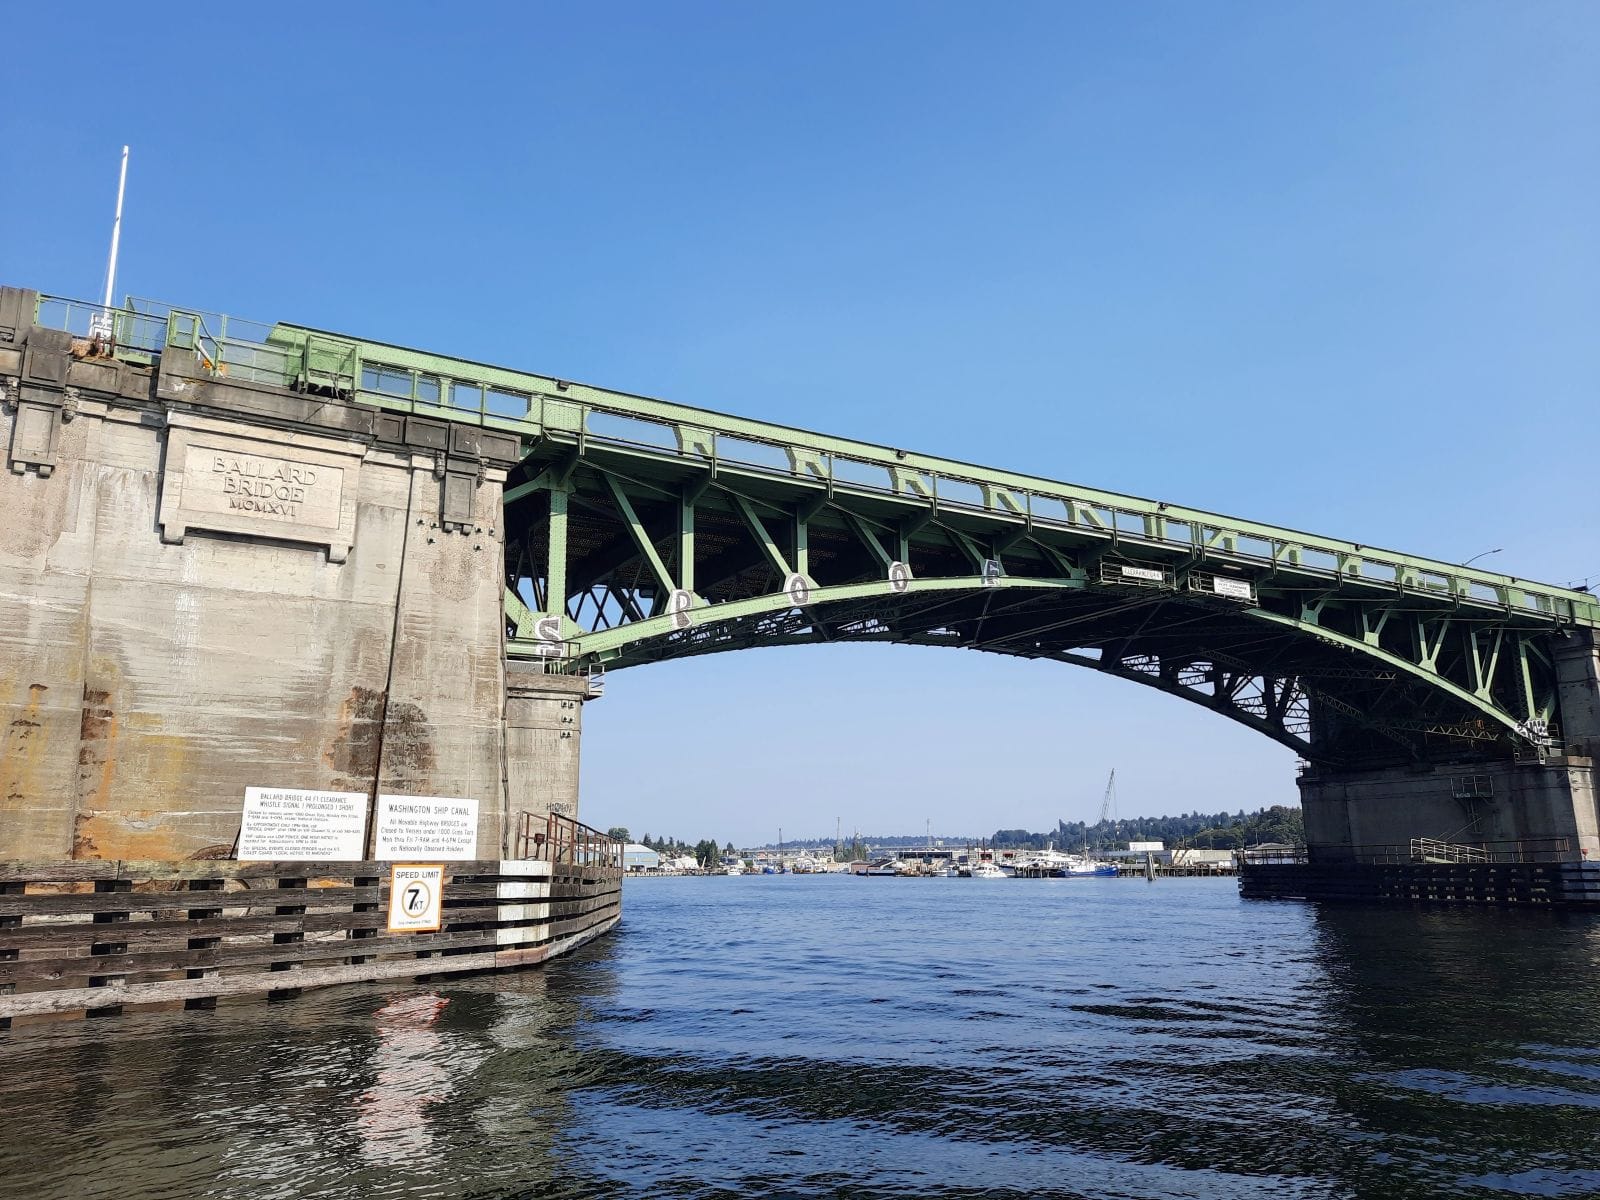
- Plan and design high-priority bridge replacements to begin after 2024. This is likely a reference to the Magnolia and Ballard bridges, which are rated as structurally deficient, among other bridges that may need replacement after the life of the levy.
- Repair and rehabilitate major stairways. No concrete goal here.
- Eliminate the backlog of bridge spot repairs. With those 182 repairs already completed, the backlog stands at 846, according to the dashboard.
Foster a Healthy Urban Forest. The last metric relates to Seattle’s street tree inventory: Move Seattle proposes compiling a 100% inventory of the condition of street trees for “optimal stewardship”. It’s again worth noting that after the completion of such an inventory we will not have a record of the state of the sidewalks under those street trees.
The Move Seattle dashboard is a good step toward transparency for Seattle’s transportation planning. It’s also a telling document that speaks just as loudly for the things that are not included as it does for the things that are.