

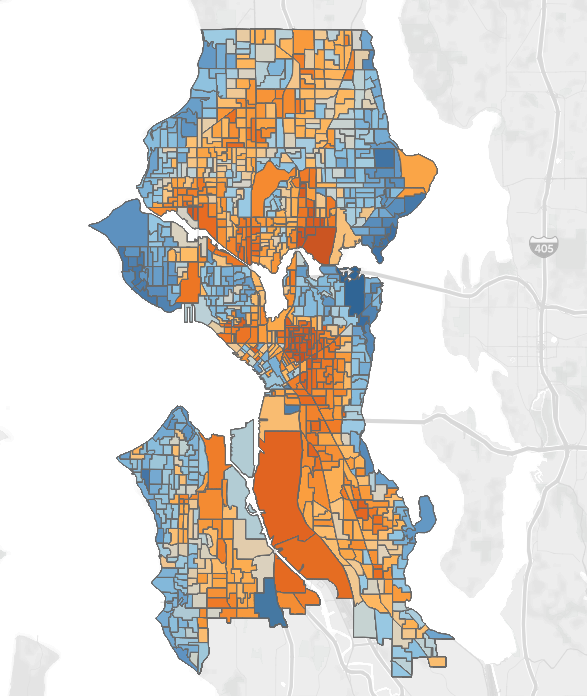
Seattle Mayor-Elect Katie Wilson just won a very close election, and new precinct-level final data shows just how that battle played out on a block by block level. Long story short: an old geographic pattern in Seattle politics played out on steroids. Centrist incumbent Bruce Harrell dominated the wealthy coastal areas and ridgeline view corridors where the typical housing type is single family homes. And the progressive challenger dominated in apartment-heavy urbanized areas where younger Seattleites live, especially her home neighborhood of Capitol Hill.
The split was so pronounced that Wilson won only two of the seven Seattle City Council districts — Districts 2 and 3 — but she won them dramatically enough to make up for weaker performance elsewhere. Wilson lost three districts by a fairly significant spread — 1, 4, 7 — but essentially ran to a draw in North Seattle’s District 5 and 6.
- District 1 (Southwest Seattle) – Harrell won by 6.5 points.
- District 2 (Southeast Seattle) – Wilson won by 12 points.
- District 3 (Capitol Hill, Central District, etc.) – Wilson won by 16 points.
- District 4 (UW / Greater Laurelhurst) – Harrell won by 6.5 points.
- District 5 (Far North Seattle) – Harrell won by a narrow margin of 0.7 points.
- District 6 (Greater Ballard) – Harrell won by a razor-thin margin of 0.3 points.
- District 7 (Greater Downtown and Queen Anne) – Harrell won by 3 points.
Data scientist and local urbanist Jason Weill created an interactive final precinct results map that tells the tale. In Weill’s color scheme, precincts that Wilson won are orange and Harrell’s precincts are blue. The darker the shade of color, the greater the margin of victory. Washington Community Alliance also has a precinct results mapping tool that covers races statewide.
Zoning map mirrors political results
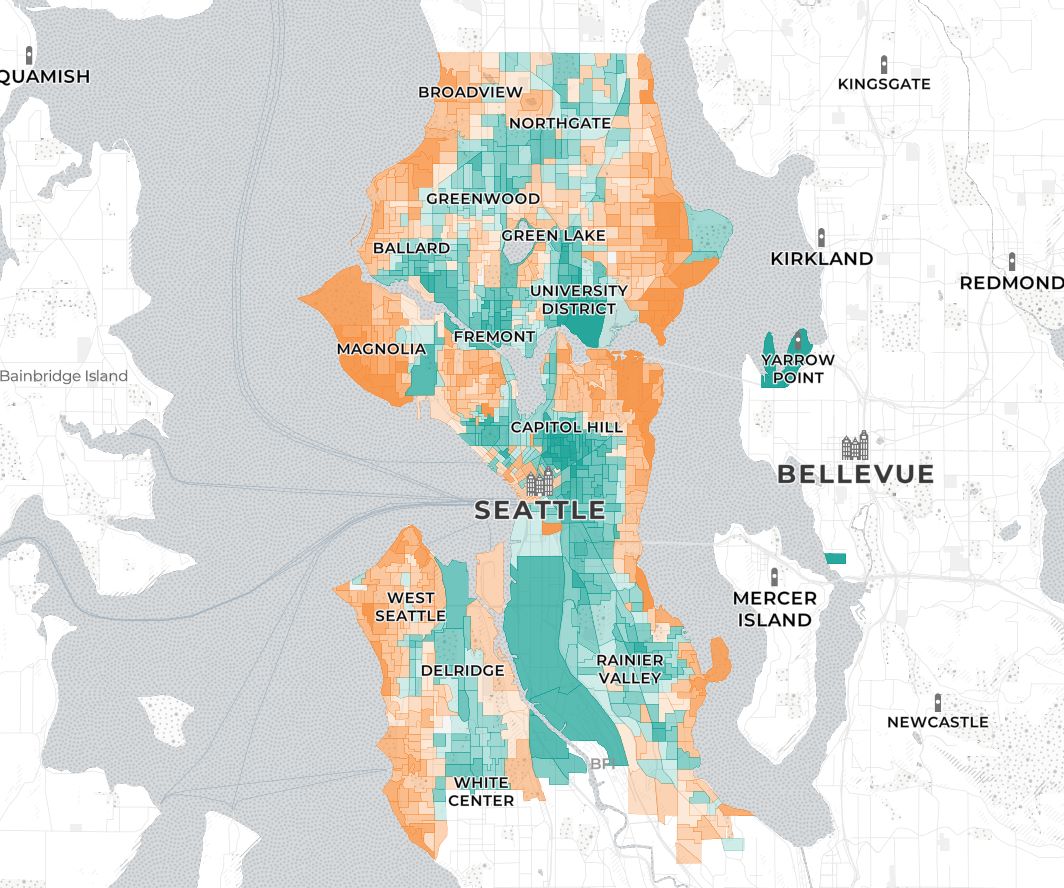
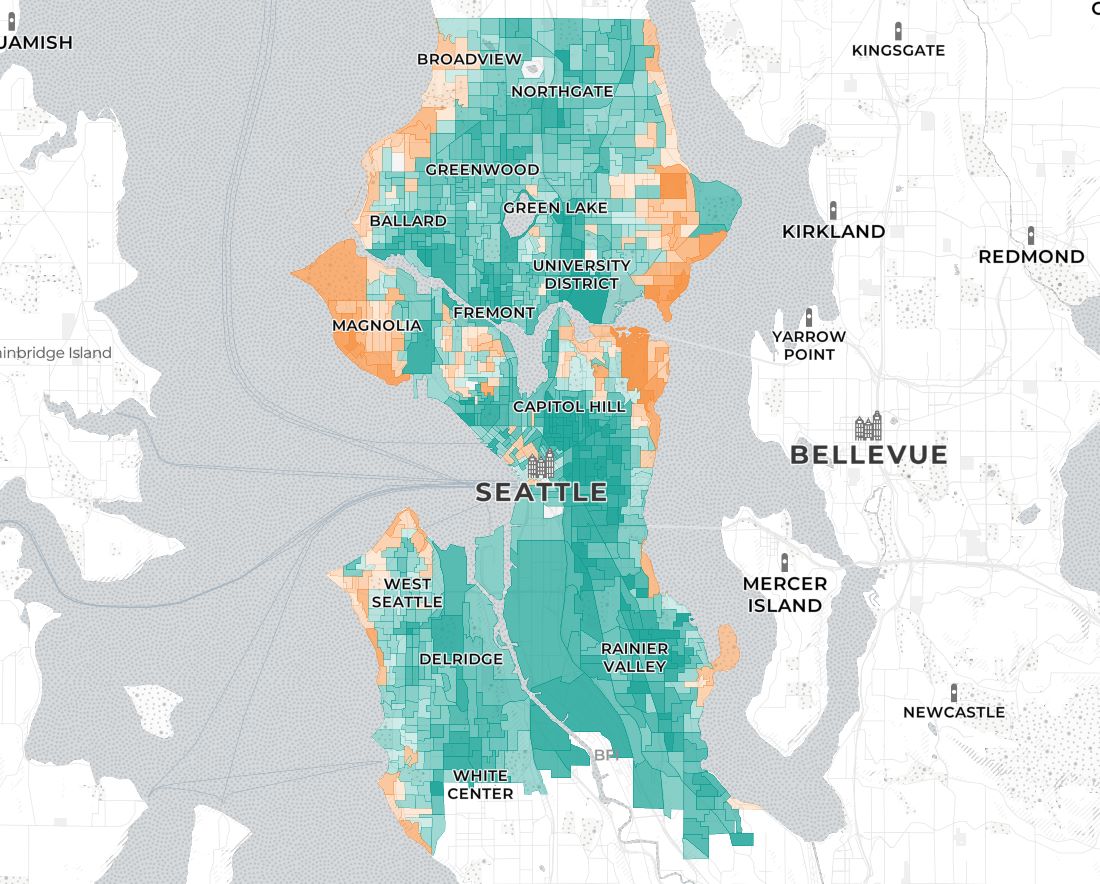
As many an urbanist has pointed out, Seattle’s zoning map strongly echoes through in maps of political results. Areas zoned for high-density housing swing toward progressives, to a large degree. Political shifts from election to election are largely a matter of how steep the turnout advantage is for single family areas and which way medium-density neighborhoods swing. Apartment zones are shown in orange, brown, or purple in the zoning map below, while single family zones are a canary yellow.


Facing a state mandate deadline, Seattle recently rezoned single family areas citywide to allow fourplexes and sixplexes — and in some circumstances going beyond the state minimum baseline to permit larger multiplexes, like 12-plexes or even 16-plexes. Harrell dragged his feet on embracing apartment zoning more broadly, overruling his own planning department, which proposed broader upzones for apartments.
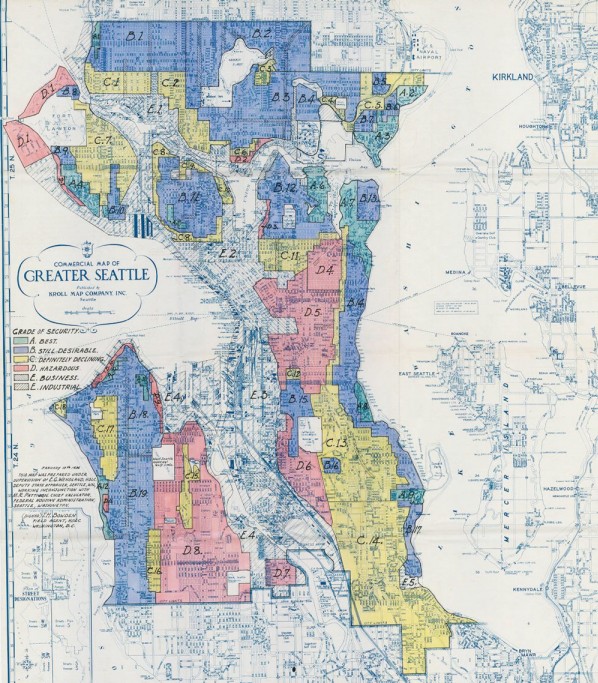
The election map also mirrors the city’s redlining map, which indicates parts of the city where banks denied homeowner loans and mortgage insurance, targeting areas where Black, Asian, and Latino communities were established. While the use of redlining maps legally ended in 1968 with the Fair Housing Act, the impacts persist in diminished generational wealth in communities of color — not to mention voting patterns.
Wilson vs. rest of the progressive slate
Overall, Wilson defeated Harrell by 0.73 points or 2,011 votes, which the closest Mayoral race in modern Seattle history. In contrast, Harrell, won by 17 points in 2021, when the areas of progressive support shrank considerably on the map.
Other progressive candidates had a much easier time of it this cycle. Progressive challenger Dionne Foster defeated Seattle City Council President Sara Nelson by nearly 26 points. Harrell won nearly 40,000 more votes than Nelson. This means a significant subset of voters voted Harrell for Mayor, but backed progressives Foster and Rinck for Council. Eddie Lin defeated Adonis Ducksworth, more than doubling up on his opponent by winning 68% of the vote. Former federal prosecutor Erika Evans also doubled up incumbent Seattle City Attorney Ann Davison, who is the city’s only Republican in office.
This was not purely anti-incumbent mood. Progressive incumbent citywide Councilmember Alexis Mercedes Rinck grabbed a whopping 81% of the vote facing a conservative challenger — a 63-point win. Wilson precincts were Rinck’s strongest areas, but she also won just about everywhere.
It added up to a clean sweep for the progressive slate in the city, all of The Urbanist Elections Committee (of which I am a member) endorsed.
District 1 – Harrell coasts
District 1 was effectively split down the seam, with Harrell dominating the western coastlines and bluffs. Wilson did much better to the east in Delridge, White Center, Georgetown, South Park and in Junction, one of the few pockets of significant urban density in West Seattle.
Seattle mayoral election results, visualized by city council district. (Approximate; some precincts have been redrawn since the last district-specific council elections.) In district 1, incumbent Bruce Harrell led challenger Katie Wilson by about 6.5 points. Wilson won by less than 1 point citywide.
— Jason Weill (@weill.org) November 27, 2025 at 5:32 AM
[image or embed]
District 2 – Wilson wins Rainier Valley
At first glance, District 2 precincts look fairly evenly split, but looks can be deceiving. Wilson won the heavily-populated precincts in the MLK Way light rail corridor and the frequent bus corridor along Rainier Avenue S, and she won many of them by wide margins that ran up her total to a nearly 12-point win in D2. The brightest orange precinct, in the heart of Columbia City, she won with just over 80% of the vote.
In district 2, covering much of southeastern Seattle, Wilson defeated Harrell by nearly 12 percentage points.
— Jason Weill (@weill.org) November 27, 2025 at 5:33 AM
[image or embed]
Harrell has some areas within D2 where he surpassed 80% as well, but they are limited to a few waterfront precincts and were not enough to turn the tide, given Wilson’s dominance across much of the Rainier Valley and in Little Saigon. Wilson did well in more apartment-heavy North Beacon Hill, but South Beacon Hill was more of a mixed bag. Harrell managed to win the lion’s share of precincts in the far south near Rainier Beach, but by fairly small margins.
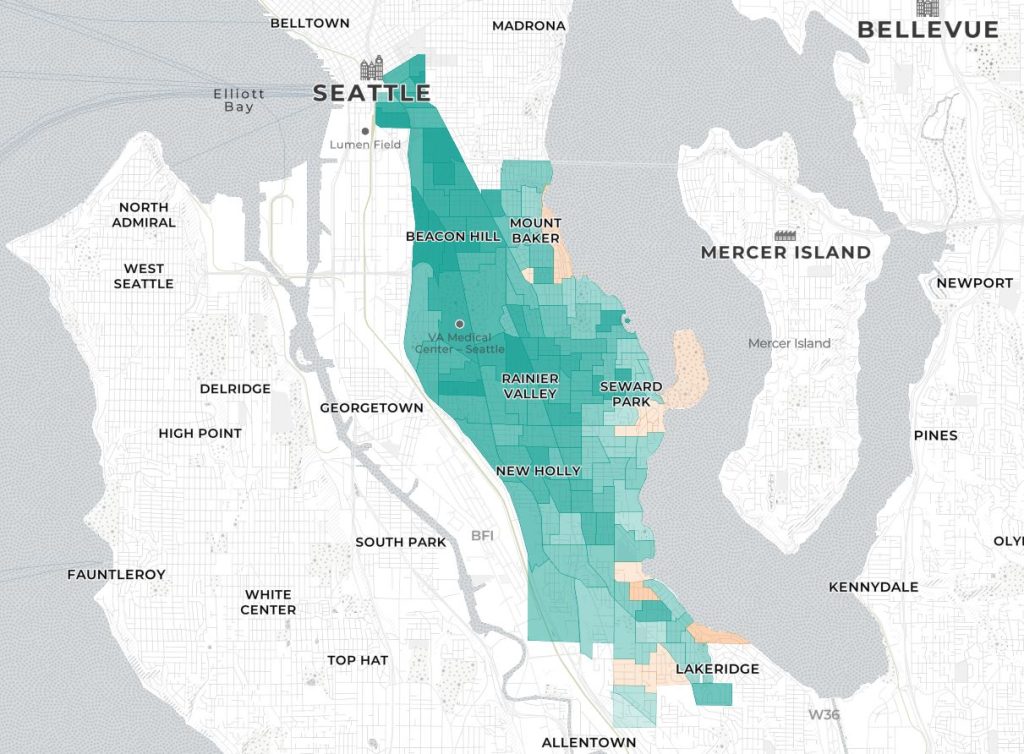
It’s a somewhat surprising result for Harrell, who once represented D2 on the city council, before stepping down in 2019. His old district was his second weakest in the city. Results indicate progressive Eddie Lin is much more of a fit for the district now, rather than centrist Adonis Ducksworth, who in fact may have been weighed down by his association to the mayor, who tapped him to be his transportation policy advisor.
District 3 – Wilson’s stronghold
District 3 is where the Wilson campaign sealed the deal. Their 16-point margin in D3 was enough to carry the day citywide. The margin of victory stemmed from massive vote shares throughout Capitol Hill and a virtual sweep of Central District precincts. Wilson often surpassed 80% of the vote in Capitol Hill precincts and exceeded 90% in a few.
Katie Wilson performed most strongly in her home district, district 3, winning by more than 16 percentage points.
— Jason Weill (@weill.org) November 27, 2025 at 5:34 AM
[image or embed]
Ironically, Harrell also had his best precinct performance in D3, winning 95% of the vote in Broadmoor, a gated community enveloped in a private golf course. Wilson won just 19 of the 420 votes cast in Broadmoor. Harrell won handily throughout Montlake, Madison Park, and Madrona — with proximity to Lake Washington seeming to juice his totals.
On the other hand, Wilson pushed the old “Republican” boundary a bit farther north. The adage used to be that E Republican Street formed the border where the progressive bastion of Capitol Hill ended and gave way to the more conservative-leaning centrist precincts to the north. The people along Republican Street mostly voted with Wilson this year, as the orange stretched all the way to Volunteer Park. If this pattern holds, that would roughly make Aloha Street (three blocks to the north) the new boundary between the People’s Republic of Capitol Hill and conservative-voting mansion land. Aloha, hello and goodbye.
The only Wilson precincts north of Aloha Street in D3 are in Eastlake, where Wilson did well. Harrell did win one Eastlake precinct along the Lake Union waterfront. Meanwhile the eastern border, where orange precincts of the Central District give way to waterfront bluff blue, is 31st Avenue, which shows up quite clearly in the precinct map.
District 4 – Harrell gains edge in Northeast Seattle
District 4 was tied for Harrell’s best district, powered by a strong performance in its eastern half, a wealthy area dominated by single family homes. Broadly speaking, Wilson won East Fremont, Wallingford, the University District, Roosevelt, and Sand Point. However, Harrell won virtually everything else and with higher turnout rates, swamping Wilson’s advantage to the east. D4 should be winnable for progressives, but it’s a tall task if the turnout is tilted so heavily toward wealthier single family areas.
Harrell's most fruitful city council district was district 4, in which the incumbent outdrew the challenger Wilson by just over 6.5 points. There was a pronounced split between the UW area and the Laurelhurst area.
— Jason Weill (@weill.org) November 27, 2025 at 5:36 AM
[image or embed]
District 5: Split down the middle
District 5 was fought nearly a draw, which is good news for progressives heading into a special election next year to pick a replacement following Councilmember Cathy Moore’s resignation this summer. (For now, Debora Juarez holds the seat in an interim capacity.) Wilson did well in Greenwood, Crown Hill, Licton Springs, Northgate, Pinehurst, and much of Lake City. Harrell did well in Blue Ridge, Broadview, Matthews Beach, and Haller Lake. That was enough for him to win by 0.7 points.
District 5 was roughly evenly split between Harrell and Wilson. Harrell led overall by less than 1 point, winning all but one precinct on the shore of Lake Washington, Puget Sound, or Bitter Lake.
— Jason Weill (@weill.org) November 27, 2025 at 5:38 AM
[image or embed]
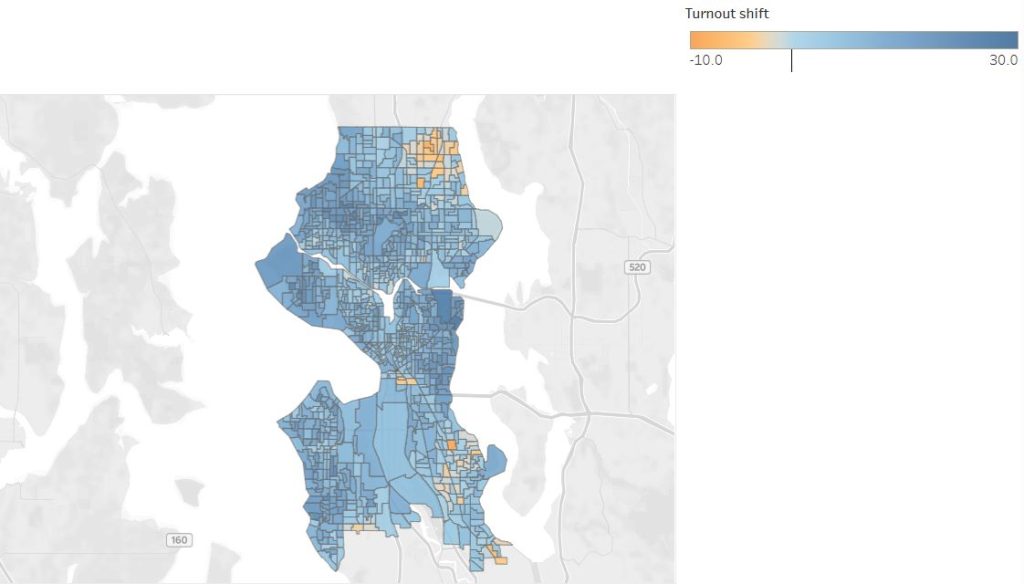
Since next year’s special election will happen in an even year, turnout should be significantly higher than in typical odd-year municipal elections. Generally speaking, precincts that Wilson won had lower turnout this year than precincts that Harrell won. Higher turnout across the board would appear to help progressives more than centrists, who already benefit from high turnout in odd-numbered years.
District 6: Draw
District 6 was the most evenly split district. Just 205 votes separated the candidates, with Harrell barely gaining the upper hand. Neighborhood by neighborhood, the divides were stark. Harrell swept Magnolia and won Sunset Hill, North Beach, and most of Phinney Ridge and Green Lake. Wilson handily won Ballard and Fremont.
In District 6, the closest result of any council district, Harrell defeated Wilson by 205 votes. Note the clean Harrell sweep in Magnolia.
— Jason Weill (@weill.org) November 27, 2025 at 5:40 AM
[image or embed]
The Wilson precincts are more densely populated and better served by transit. In fact, you can nearly see the gaps in transit service in where Harrell did well. Seattle’s crosstown bus service is infamously mediocre; where there is some crosstown service, like along Market Street and along 85th Street, Wilson generally won. Between NW 65th Street and NW 80th Street is a dead zone for crosstown service, and this is precisely where Harrell had his broadest band of support, stretching from Green Lake to the Shilshole Bay Marina nearly continuously.
District 7 – Queen Anne’s revenge
District 7 is perhaps the most mixed up district of all. Harrell did well in many corners of downtown, but Wilson mostly cleaned up in Lower Queen Anne, South Lake Union, Cascade, Belltown, First Hill, Interbay, and Nickerson. One citywide pattern that did hold is that Harrell did very well in the ritzy view corridor areas of Upper Queen Anne and the western Magnolia bluff. The end result is a three-point win for Harrell.
Harrell defeated Wilson in District 7 by about 3 points, including a sweep of upper Queen Anne precincts.
— Jason Weill (@weill.org) November 27, 2025 at 5:41 AM
[image or embed]
While Wilson came up a bit short in D7, the other progressives won there this year. Clearly, it’s a district that could break either way when centrist Councilmember Bob Kettle goes up for reelection in 2027.
How Harrell made it close
Why Harrell outperformed the other centrist candidates is a topic that many pundits have already taken a stab at explaining. The Urbanist Podcast discussed the topic recently on the first episode of our relaunch. One simple answer is that Harrell largely ran as a progressive, rather than emphasizing his centrism.
The greatest example of Harrell shifting in a progressive direction is his decision to back a tax hike on big business via the Seattle Shield Initiative, which restructured the business and occupation tax. Harrell opposed tax increases for nearly his whole mayoral term, but his conversion on his political death bed nearly saved his skin — recasting himself in a more progressive light to match the mood of the electorate.
In contrast, Nelson doubled down on her conservative messaging and record and paid the price. Without more of an effort at a rebrand, voters treated Nelson similarly to a Davison, who is an out-and-out Republican. And while Harrell has the local kid football star turned star lawyer backstory, Nelson’s personal narrative and charisma is less stellar.
The other key part of the Harrell overperformance was that he launched repeated waves of negative attacks on his opponent hard and appeared to land some hits. Rather than an earlier scattershot approach that tried to brand Wilson as an extremist by tying her to hardline socialist Kshama Sawant, the Harrell camp used a more insidious and surgical approach, criticizing Wilson for a lack of management experience and for not completing her college degree. That was enough to sap some momentum from Wilson, after she won the August primary by nearly 10 points.
The college dropout attack, and a last-minute push to ding Wilson for accepting financial help from her parents to pay for child care during her campaign, was part of Harrell’s effort to undermine her working class appeal. Harrell tried to make bolder promises himself to steal some of her thunder. After the primary, Harrell proposed an “anti-gentrification and reparations fund” that initially pledged $80 million in new spending. This turned out to be a rebranding of existing programs with no new money, when in reality his budget proposal actually tied his rhetoric down.
One area where the negative messaging clearly seemed to hit home was in depressing turnout in certain precincts. Some precincts that favored Wilson saw their turnout rate decrease from the primary to the general, even as turnout increased overall citywide in the general election. Notable exceptions included a handful of Lake City and Columbia City precincts, where Wilson won. The drop in turnout in those areas hurt her margin. Meanwhile, waterfront precincts were Harrell dominated saw some of the biggest spikes in turnout.
All in all, it was a remarkably close race, but a close win counts the same as a blowout. The progressive path to victory continue to run through urban centers, where voters are more likely to live in apartments and ride transit. As the co-founder of the Transit Riders Union and a long-time housing and tenant’s rights advocate, Wilson’s message resonated greatly with these voters and earned her big margins, and that was enough to carry her to victory.
Since Seattle’s trajectory is toward urbanization and building more multifamily housing and transit, it’s a formula that should get stronger with time.

Doug Trumm is publisher of The Urbanist. An Urbanist writer since 2015, he dreams of pedestrian streets, bus lanes, and a mass-timber building spree to end our housing crisis. He graduated from the Evans School of Public Policy and Governance at the University of Washington in 2019. He lives in Seattle's Fremont neighborhood and loves to explore the city by foot and by bike.