Bruce Harrell dominated along the coastal ridges, while Lorena González's areas of strength were limited ot area like Capitol Hill, the Central District, Columbia City, Westwood Village, Fremont, Greenwood, and Lower Queen Anne. (Viz by Jason Weill)

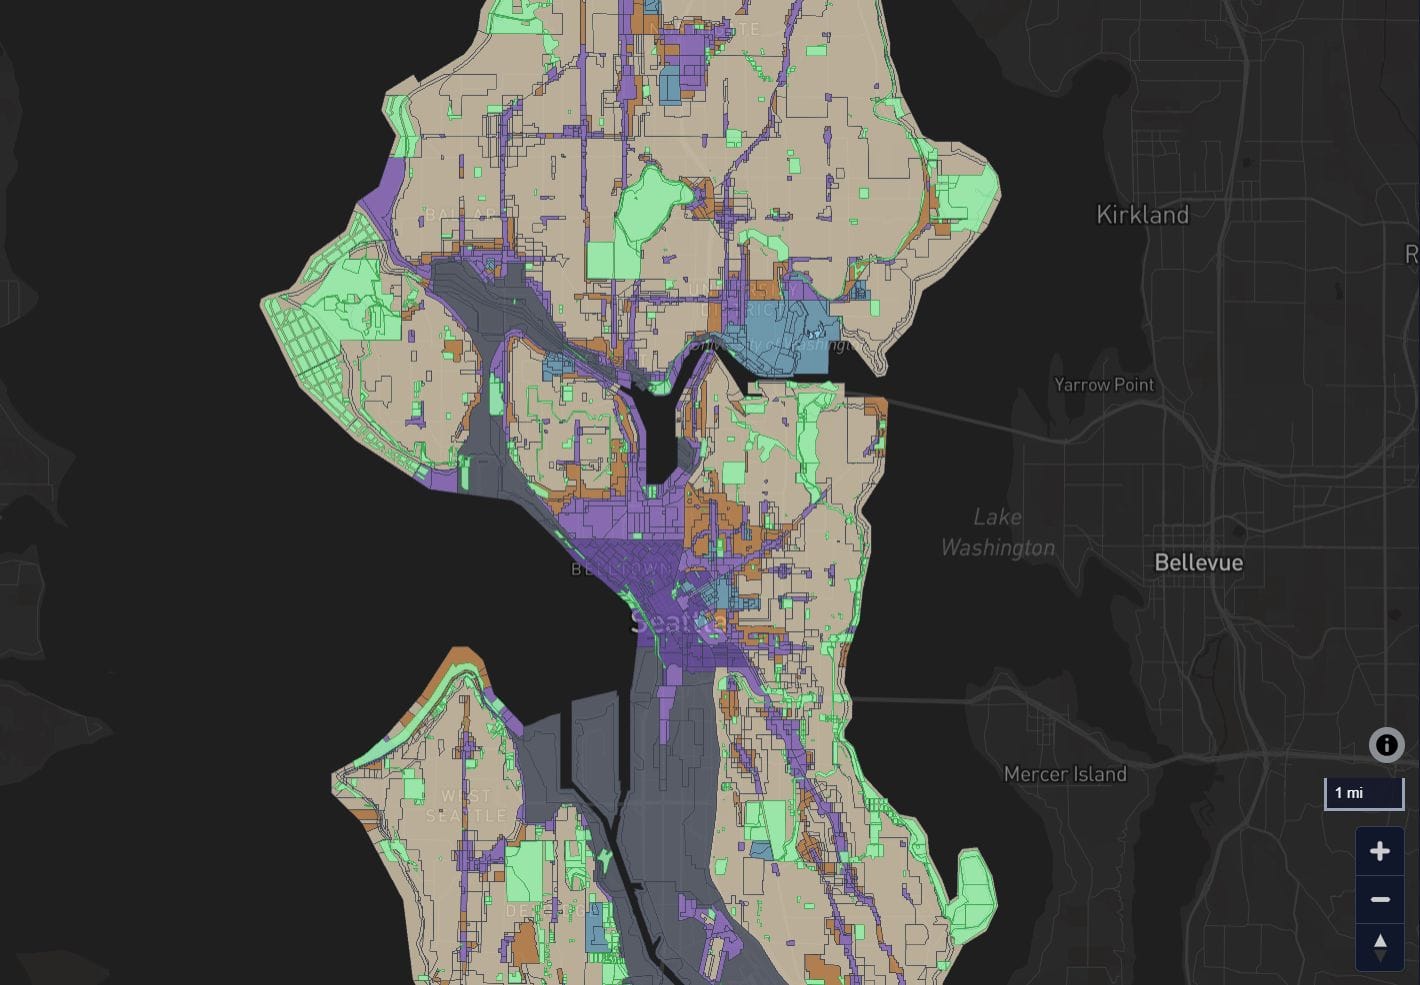
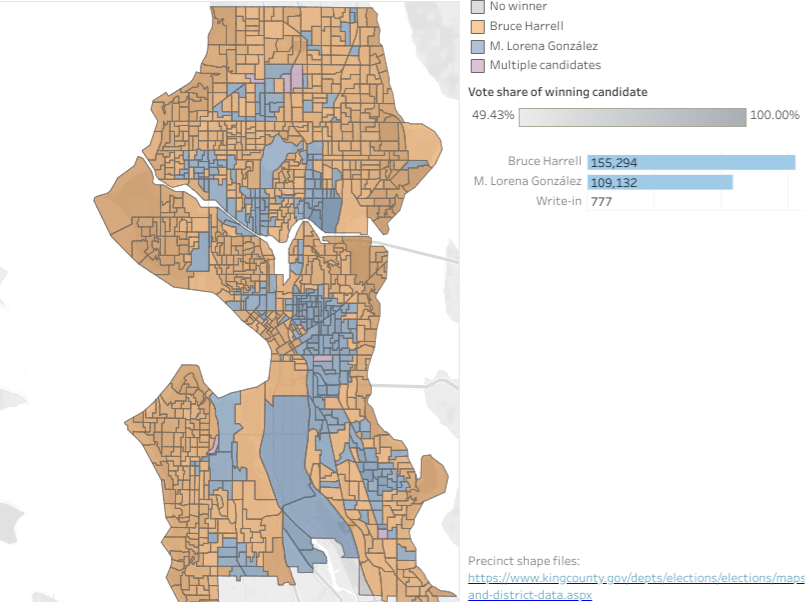
Single family zones overwhelmingly swung for Mayor-Elect Bruce Harrell, Councilmember-Elect Sara Nelson, and Seattle City Attorney-Elect Ann Davison, as new precinct-level final results map verify.

Harrell’s 17-point victory over Council President Lorena González was the most resounding, while Davison (the first Republican elected in Seattle in decades) won by just four points over abolitionist Nicole Thomas-Kennedy. However, the pattern of denser multifamily areas supporting more left-leaning progressive candidates remains pretty consistent across the races.

For Harrell this meant nearly a clean sweep in some of Seattle wealthiest enclaves. Some Laurelhurst precincts gave Harrell more than 90% of their votes and most Magnolia precincts more than 80%. Meanwhile 98% of Broadmoor backed Harrell, and he cleared 94% in one View Ridge precinct (a ritzy area west of Magnuson Park that isn’t shy about announcing its view corridor status). Seward Park, where Bruce Harrell lives, gave 82% of their vote to him, while González barely eked out victories in the core of West Seattle Junction, where she lives, while losing the rest of the peninsula pretty handily.

Most of North Seattle was a blood bath, too. González had showed more strength there in the primary — when Harrell and González together took nearly two thirds of the vote. However, it appears the third of the electorate the pair didn’t win in the primary broke heavily toward Harrell rather than her, flipping some of those precincts.

González had precincts where she cleaned up, but not nearly to the degree that Harrell did in view corridor land. A good precinct for González topped out in the 60% range rather than the 80s and 90s that Bruce managed. And that proved decisive, especially when paired with a strong turnout advantage for older homeowners over younger tenants living in the denser core of Seattle.

Councilmember Teresa Mosqueda won by 19 points over civil engineer Kenneth Wilson, but she also saw her greatest strength in dense urban center as opposed to the single family view corridors that were a bastion of strength for the centrist slate. Most coastal precincts are still red in Mosqueda’s map, but the interior is so solidly blue that it more than canceled out that advantage. Dominating urban villages and carrying the interior appears to be the formula for progressive candidates to win, but only Mosqueda pulled it off facing a lackluster opponent. Harrell, Nelson, and Wilson all ran on preserving single family zoning, but that issue alone didn’t appear decisive given Wilson’s struggles. A recent poll found adding density in single family zones is popular among voters, although less so with seniors who are the most reliable voters.

The pattern of single family zones preferring more conservative candidates and apartment-heavy urban villages breaking for progressives has been persistent in recent elections. The difference in the 2021 election appears to be how strongly single family zones broke for the centrist slate and turned out in greater numbers than denser precincts. U District turnout in particular seemed abysmal. Precinct maps from 2019 shows progressive Council candidates ran up their totals in the dense core neighborhoods to a greater degree while not losing single family zones quite so badly.

González vs Oliver results

Nikkita Oliver outperformed González across the city, but the differences in the maps are most stark in South Seattle. As a Garfield graduate, former District 2 Councilmember, and Black and Japanese American son of Seattle, Harrell made significant inroads in D2 over a typical business lane candidate. A significant portion of D2 voters split their ticket and backed both Harrell and Oliver, despite their platforms and messages being quite different.

Mosqueda vs González

Mosqueda fared much better than her counterpart on Council. The waterfront still trended toward the centrist candidate, but Mosqueda won more precincts on the slopes and had a nearly solid wall of blue down the interior of Seattle. Wilson had a pocket of support in West Seattle, but underperformed Nelson, which suggests an early hasty opening of the West Seattle Bridge was not a potent motivator for peninsula voters like he hoped.

Past maps

A look back at the 2017 results map shows Jenny Durkan precincts ended up being Harrell precincts four year later, plus some South Seattle additions. History has repeated itself.

Jenny Durkan won in green precincts and Cary Moon won in orange precincts in this 2017 General Election results map. Intensity of color shows intensity of win. (Map by Dennis Bratland, Wikimedia Commons)

In 2013, Ed Murray rode basically the same mix of precincts to victory. That formula has only gotten stronger in Mayoral elections. Murray won by 4 points, Durkan won by 13 points, and now Harrell by 17 points. While single family areas haven’t been adding much population due to their restrictive zoning, Downtown has been the fastest-growing area of the city over the last decade, and much of it has gone for the centrist slate in the last three Mayoral elections. But Downtown and South Lake Union also went for Andrew Lewis in 2019, suggesting a more complicated picture.

The greener the district, the more it broke for Ed Murray. Mike McGinn was strong in the orange and red areas. (Map by Benjamin Andersone)

As The Urbanist notes every election, the results map continues to mirror Seattle’s zoning map. Single family zoning and more conservative voting patterns seem to go hand-in-hand, especially in the wealthier parts of town. Areas with urban zoning went for progressives, with the exception of Downtown. Perhaps a Frazier factor is in play, with residents of Downtown apartments and condos being wealthier than multifamily dwellers citywide. Homelessness also could have been a potent wedge issue there.

The map shows where Mandatory Housing Affordability rezones were implemented in 2019 in mutlfamily zones across the city. The Downtown core and University District were rezoned earlier in 2017.
Seattle’s multifamily zoning is highlighted in green and pink. The Mandatory Housing Affordability (MHA) program upzoned multifamily areas and added inclusionary affordability requirements but left all single family zoning outside of urban villages untouched. (City of Seattle)

Redlining maps still echo as well in election results maps. Parts of the city that were redlined and historically denied investment opportunities make up the progressive base, while the areas ranked the most desirable (where incidentally White people were showered with federally-backed mortgages that built up their wealth) continue to compose the conservative base.

A 1936 redlining map shows the Central Area, Delridge, and Georgetown redlined, while the Rainier Valley, Junction, and lower Ballard and Fremont are in yellow indicating less desirable and worsening areas for banks to make loans.
Seattle’s redlining map from 1936. Red areas were deemed “hazardous”, yellow areas were rated “definitely declining” and blue and green areas were christened “desirable.” Discriminatory lending and real estate practices confined Black people to redlined areas, particularly the Central District. (Map by Knoll Company)

After three straight losses, progressives must certainly look to flip the script and change the mayoral map. Seattle’s tenant population is growing faster than its homeowner population, but it will not be decisive in elections if tenants don’t turn out to vote in larger numbers — particularly if Downtown tenants continue to swing toward centrist mayors. Forging a stronger coalition behind urbanist policies will take some doing, but it’s certainly within reach.

Author’s note: Thanks to Jason Weill for the excellent precinct-level maps. Check them out here for full features and hover over the precincts to see vote tallies.

Article Author
Publisher | Website

Doug Trumm is publisher of The Urbanist. An Urbanist writer since 2015, he dreams of pedestrianizing streets, blanketing the city in bus lanes, and unleashing a mass timber building spree to end the affordable housing shortage and avert our coming climate catastrophe. He graduated from the Evans School of Public Policy and Governance at the University of Washington in 2019. He lives in East Fremont and loves to explore the city on his bike.