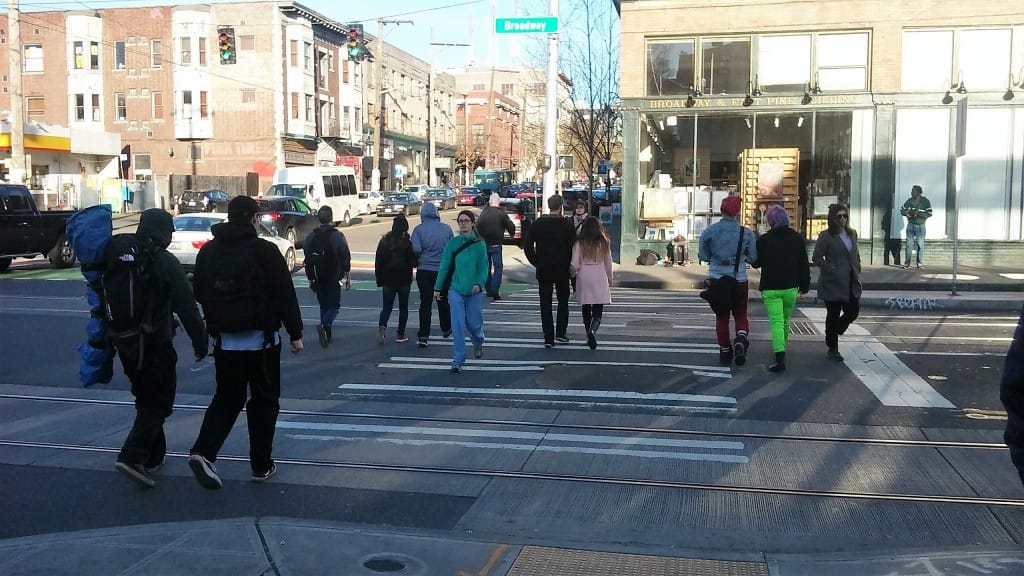
Walking in Seattle is the fastest-growing commute method citywide right now. As I will take every chance I can get to mention, Josh Feit at Publicola was the first to report that the Seattle Department of Transportation’s commute data shows that people commuting by foot grew by a whopping 50% between 2010 and 2015, by 10,000 daily travelers.
At the same time, the Seattle Department of Transportation (SDOT) is working on an update to its Pedestrian Master Plan. This will guide decisions on what investments to make and where to invest them at this critical time. Does the Pedestrian Master Plan (PMP) have a goal of what share of commute trips should be on foot–a goal to strive for? No.
When voters last November approved the Levy to Move Seattle, one of its goals was reducing commute mode share in Downtown Seattle of single-occupancy vehicles (SOVs) to 25% and increasing the mode share for transit riders to 50%.
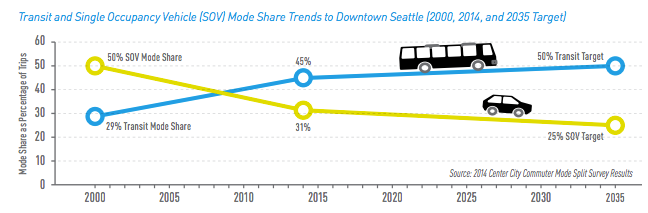
Note that the pedestrian commute share numbers I shared above were citywide, not just Downtown. The same source for the 2014 data showing 45% transit and 31% SOV share above, a Commute Seattle survey from 2014, showed a 6.9% pedestrian commute rate Downtown. The Downtown neighborhoods with much higher walk-to-work rates were Belltown (10.5%) and Denny Triangle (9.2%), with South Lake Union surprisingly sitting at a middle-of-the-pack 6.6%. Presumably those neighborhoods are also leading the pack on the unprecedented rise in pedestrian commuting through 2015–we will report on 2016 data as soon as it is available.
Pointing to the clear trend away from driving alone, the Move Seattle planning documents state:
Americans are driving fewer miles every year. That trend is true in Washington State, where the long-term forecast is for total miles traveled by vehicles to decline 18% by 2025 from its peak in 2000. At the same time, transit ridership is at record highs and growing. Fewer cars on the road mean that when you do have to drive, you’ll be up against less traffic.
Setting aside the framing that seems to suggest that the reader has to drive sometimes (and therefore is not living entirely car free), I feel it is more important to note that when there are fewer cars on the road, unless roads are reengineered for those fewer cars in the first place, streets where drivers are “up against less traffic” are more statistically likely to be where crashes occur. Enter Vision Zero and the choices that are dictated by our Pedestrian Master Plan. As vehicle miles traveled go down, SDOT success metrics should shift away from Level of Service, which rates congestion on an easy-to-read scale from A to F, to success metrics focused on the modes that are increasing.
There are a number of really great objectives laid out in the PMP, from education in street safety at schools to increasing streetscape vibrancy to people simply getting more exercise. Many of these goals have been measured since 2008 but very few of these goals have a concrete target that success could be measured by.
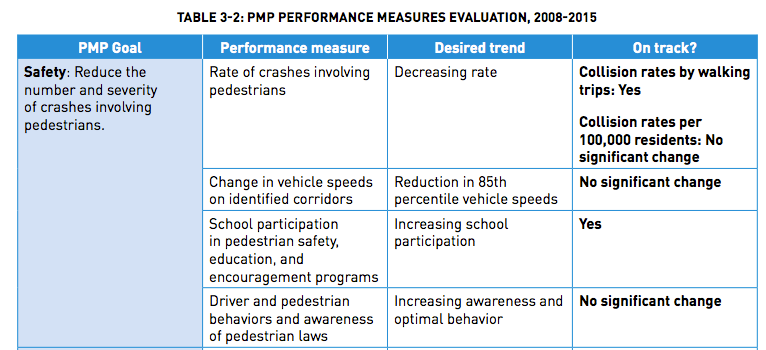
Not even the most clear Vision Zero statistic, the elimination of serious injuries and deaths by 2035, is contained in the PMP. Instead the goal is laid out as a decreasing rate of pedestrians involved in crashes.
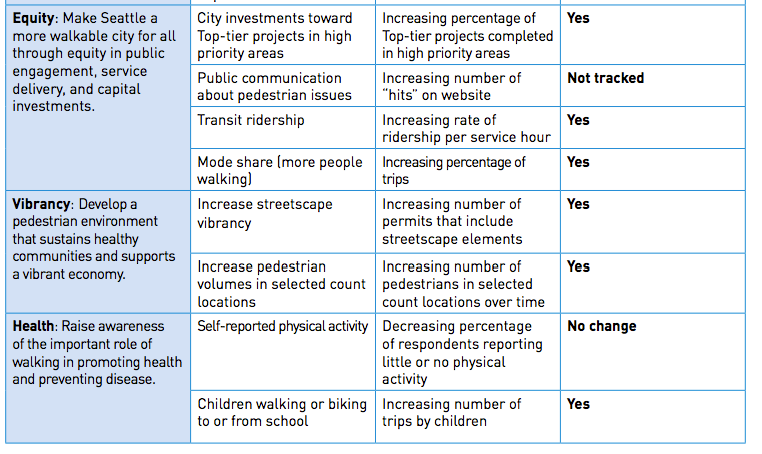
It is truly excellent to see that in a number of areas, including pedestrian mode share, transit ridership, kids walking to school, and streetscape vibrancy, we are moving the needle. But without concrete goals to tell us just how successful our master plan is, we won’t be able to truly gauge success or failure.
The Move Seattle dashboard, which is the main portal to SDOT metrics on how the levy is performing, does have a key pedestrian-oriented metric in its lineup: a goal of “100% of arterials citywide in the pedestrian priority investment network have sidewalks by 2035”. Considering that this metric was developed at a time when that criteria meant that 93% of the arterial sidewalks in the priority investment network already had sidewalks, this feels a little bit like starting a football game at the one-yard line. And the goal is to get to 100% by the end of 2035–likely requiring another transportation levy to complete after the life of the nine-year Move Seattle Levy. In fact, the Move Seattle levy only funds 250 blocks of sidewalks, with 1,804 arterial blockfaces in Seattle lacking them, and another 9,990 non-arterials.
But we’ve written before about the ways that the Pedestrian Master Plan is not set up for success in terms of funding. What would be more of a shame would be if looking back in 10 years, we didn’t even know what success was supposed to look like.
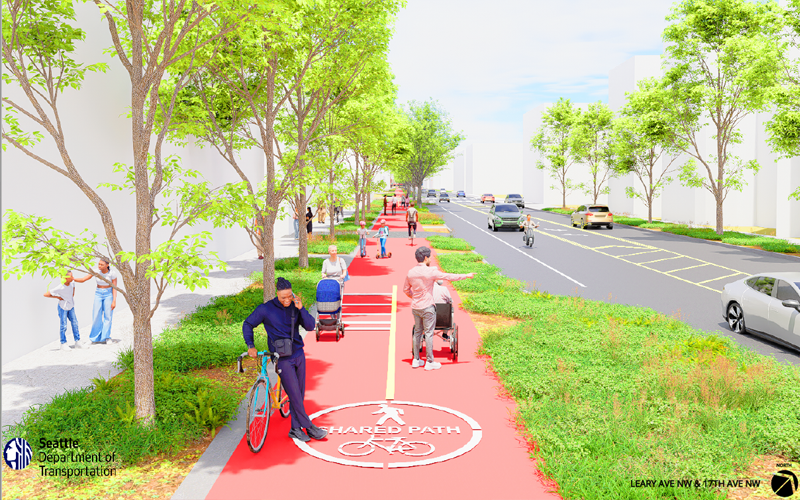
Pedestrian Master Plan Update