

Part 1 of a four-part ‘Land Use and Climate Change’ Series
Land use policy is a powerful tool to reduce greenhouse gas emissions and address climate change. So why isn’t it a bigger part of today’s climate policy debates? Over the next few weeks, I’ll be writing a series of articles here at The Urbanist to make the case for why land use policy should be a bigger priority for climate advocates, funders, and decision makers. With the recent passage of new state climate planning requirements (HB 1181), with local governments across the state making major updates to their comprehensive plans, and with an initiative on the state ballot that would repeal the Climate Commitment Act, this is a pivotal year for the climate in Washington State. We need to get it right.
Up first, today, is a post introducing land use policy, how it connects with climate change, and why it needs to be part of the solution. (I should note I am executive director of Futurewise, a nonprofit based in Washington State that works to create more livable communities, largely through land use planning and policy work.)
Second, I’ll be writing about why over the last decade many climate leaders have chosen to prioritize other strategies and why our current moment is ripe for making land use a higher priority in what comes next. Third, I will be writing about how land use policy changes can be deployed to have a large-scale impact on a short timeline, dispelling some of the myths that have discouraged climate leaders from focusing on this space. Last, but not least, I will write about why Washington State has the potential to be a national leader and show the way for other states and regions. I hope you enjoy the series and look forward to your comments and feedback.
What is land use?
As many readers of The Urbanist will already know, land use is simply how we use and steward the limited land we have for the things we need as a society. Land use policies include zoning, permitting, and all the related policies (building codes, fire codes, street design standards, historic building protections, tree protections, stormwater permits, environmental review, design review, etc) determine what can be built where and how. Washington State is one of just a few states in the country with a state Growth Management Act (GMA) that sets standards for how local governments set these policies in their comprehensive plans.
Last year, after a hard-fought campaign, the state legislature added climate change to the GMA (HB 1181). Now, local governments will be required to reduce greenhouse gas emissions and increase climate resilience through their land use policies and plans. So what does that actually mean in practice?
Compact development patterns result in lower emissions, but why?
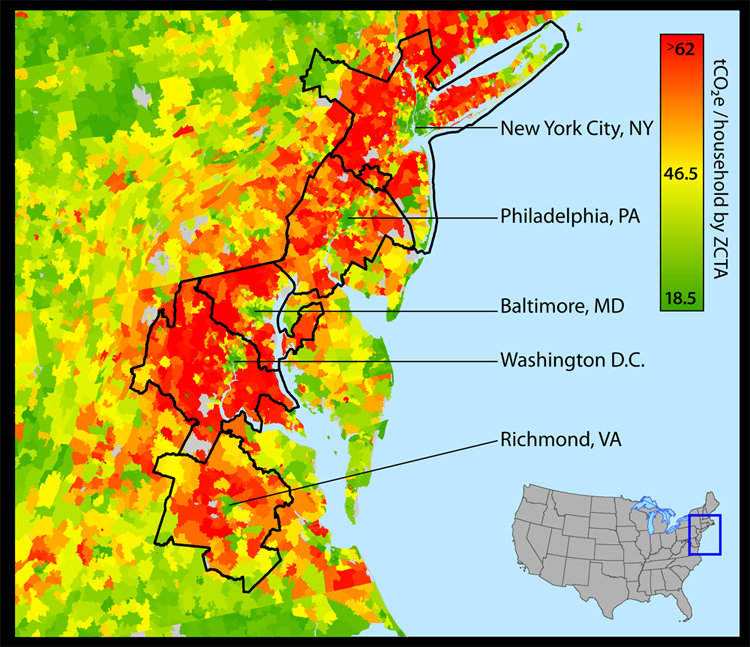
We know that per capita greenhouse gas emissions vary by place. When we map those emissions in the US, a clear pattern emerges. Central cities and rural areas have low per capita emissions. The suburbs in between have high emissions. What is causing this difference?
The biggest cause is driving. People in central cities drive a lot less than their suburban counterparts. You can see this pattern holds across US cities that we think of as having very different travel patterns, like Chicago and LA.
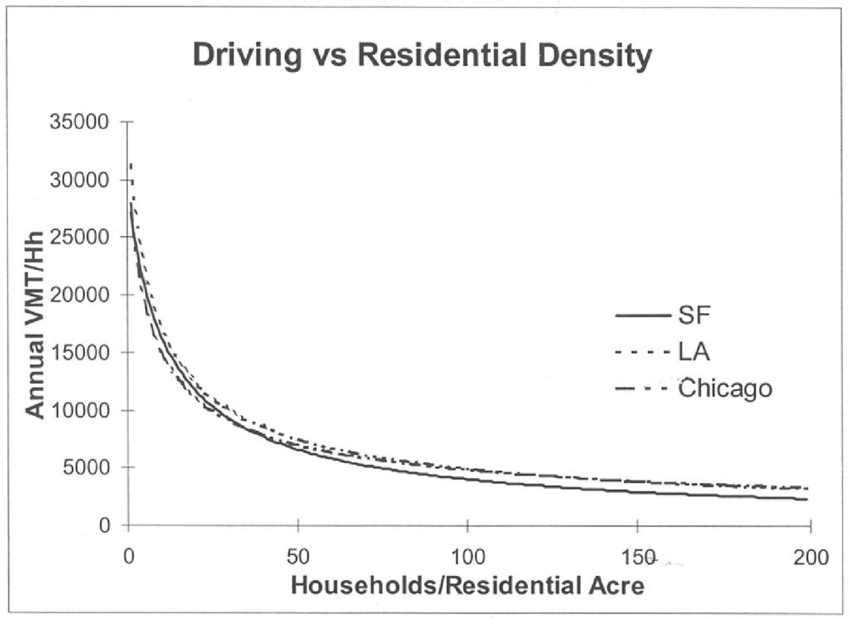
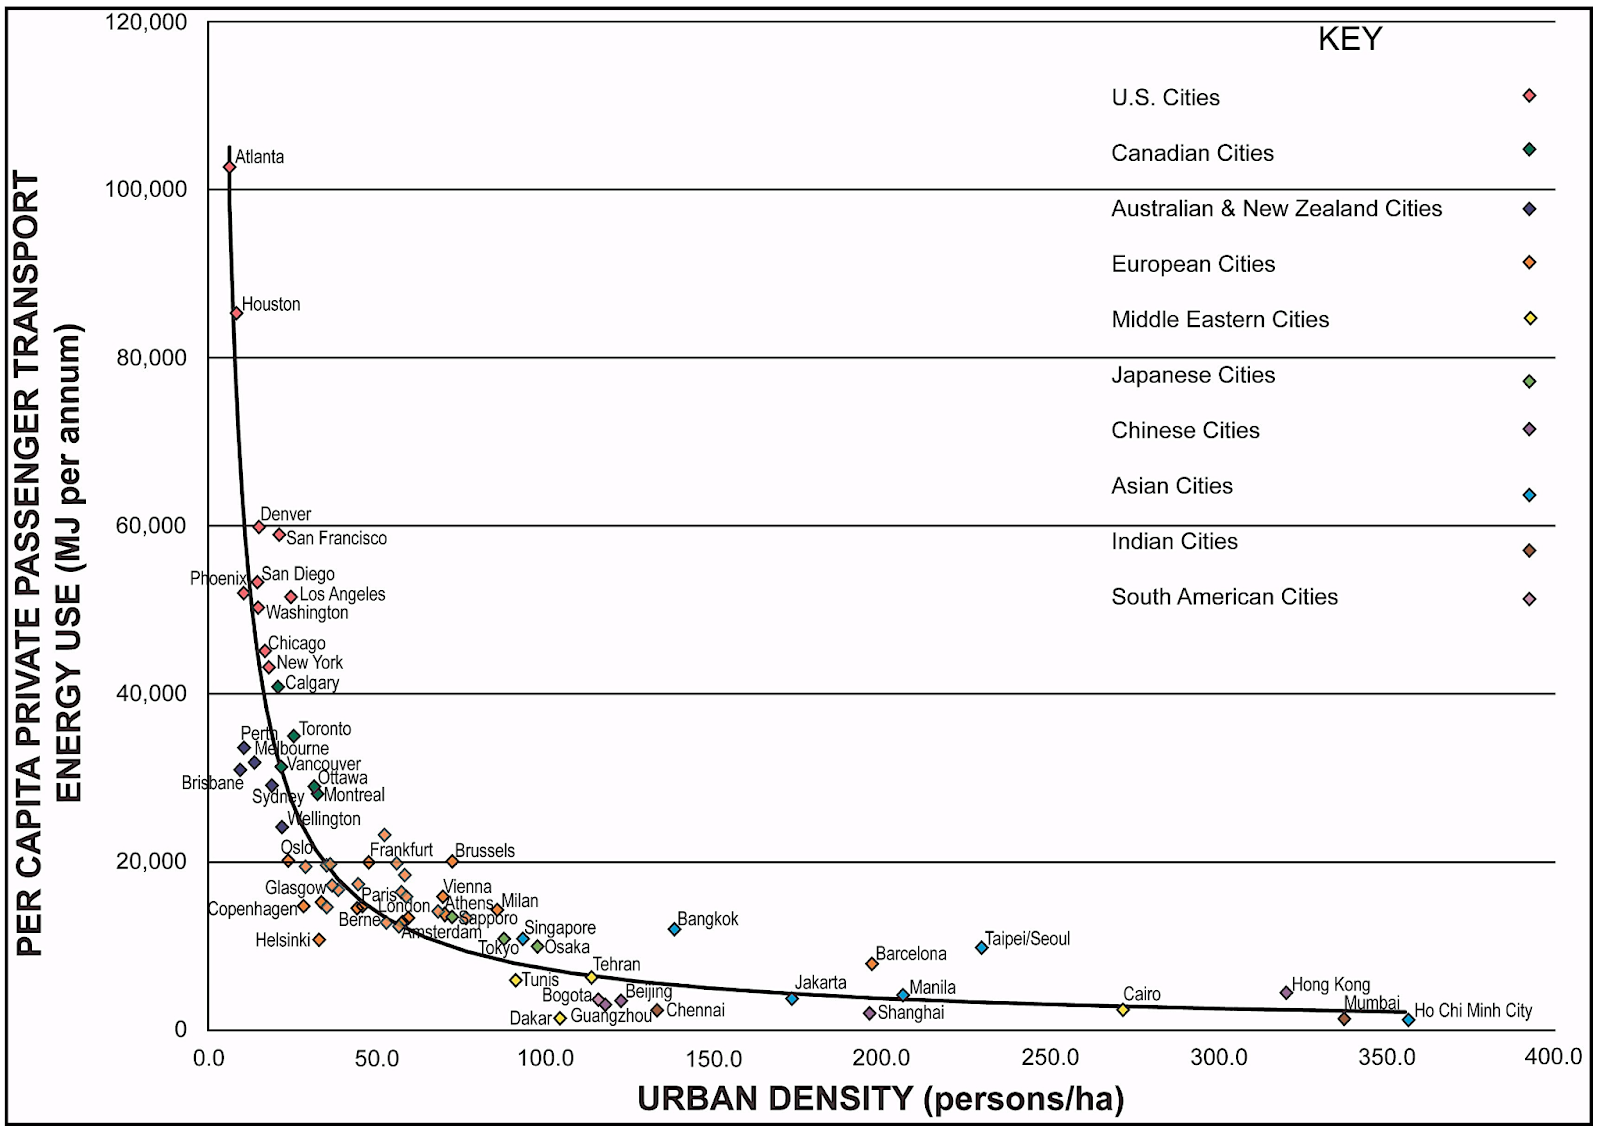
The key difference is in how many people in a given region live at which densities. In cities where more people cluster at the higher densities, the amount we drive, or vehicle miles traveled (VMT) is low. In cities where more people are spread out in the suburbs, VMT is high. In the US, most people live in much lower density neighborhoods, and you can see that makes us extreme outliers globally, in the amount we drive.
Density is not the only thing that affects how much we drive. The quality of transit service and walking, biking and rolling infrastructure are important as are the proximity of shops, major job centers, and other destinations. Incomes and the cost of driving and car ownership also play important roles. Ultimately these strategies work well together and land use is a fundamental driver that makes the other strategies more effective.
You do not have to become Hong Kong to see a reduction in driving. As you can see from the chart below, going from the density of Phoenix to the density of Paris is where the big reductions are.
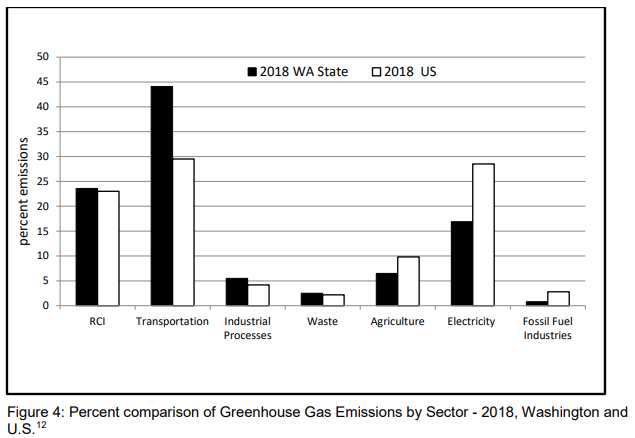
The variations we see in driving and therefore transportation emissions, make up a big part of the overall land use-climate story. Transportation is the biggest source of emissions in the US and makes up an even bigger share in Washington State, as you can see in the graph below. But transportation is not the whole story. RCI in the graph above stands for Residential, Commercial and Industrial: that’s emissions from energy use in buildings, mainly heating and cooling.
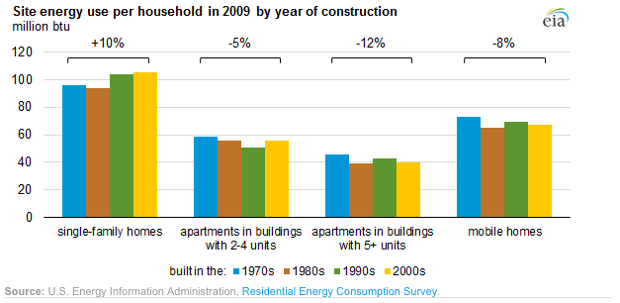
It turns out that energy use varies a lot by building type. In a single family home, every edge of the home is exposed to the outdoors. With an apartment building or even townhomes, part of each home is touching another home rather than exposed to the outside, so there is less exposed surface that needs to be insulated. This fundamental geometric difference means that multi-family structures will always be more energy efficient than single family homes built to similar standards. (Tall, skinny high-rise buildings are also very inefficient, though not singled out in this data.)
You can see from the US Energy Information Administration survey data below, even as building codes improved over the decades, the difference in energy consumption between single family and multi-family buildings is much bigger than any benefits from improved building code standards for either building type.
We also need to pay attention to the embodied carbon in buildings and in the roads and other infrastructure that serve those buildings. Single family homes need a lot of asphalt and concrete roads per home. High-rise towers are made of concrete and steel. Low-rise and mid-rise buildings that efficiently use infrastructure and are mostly made of wood generally have much lower embodied carbon.
Natural carbon sequestration
There is one more important aspect of how land use policy impacts emissions and that is the power of natural carbon sequestration. When properly protected and managed our forests, wetlands, grasslands, and farms pull carbon out of the atmosphere. This benefit is not captured in the CoolClimate carbon footprint maps at the top of the post. If it were, the rural areas would be an even more consistent green. When we cut down trees and fill in shorelines and wetlands we interrupt this process, send carbon back into the air, and reduce future sequestration. Tropical forests get a lot of the public credit for sequestering carbon, but temperate forests and tidal wetlands like those in Washington State also play an important role.
Conclusion
To recap, land use policy can have a big impact on greenhouse gas emissions. More compact cities have a lot less driving than suburbs. Apartment buildings use a lot less energy than single family homes. Keeping development in cities protects rural areas and keeps them sequestering carbon.
If these policies are so great for addressing climate change, why do they not feature more prominently in the climate movement and recent climate victories? Are these strategies good politics? How do they interact with other climate strategies? We have had great recent success promoting renewable energy and electric vehicles. If we electrify our cars and homes, does it matter how much energy they use?
These questions will be the focus of the second post in the series.

Alex Brennan
Alex Brennan is the executive director of Futurewise, a nonprofit that works to create more livable communities.