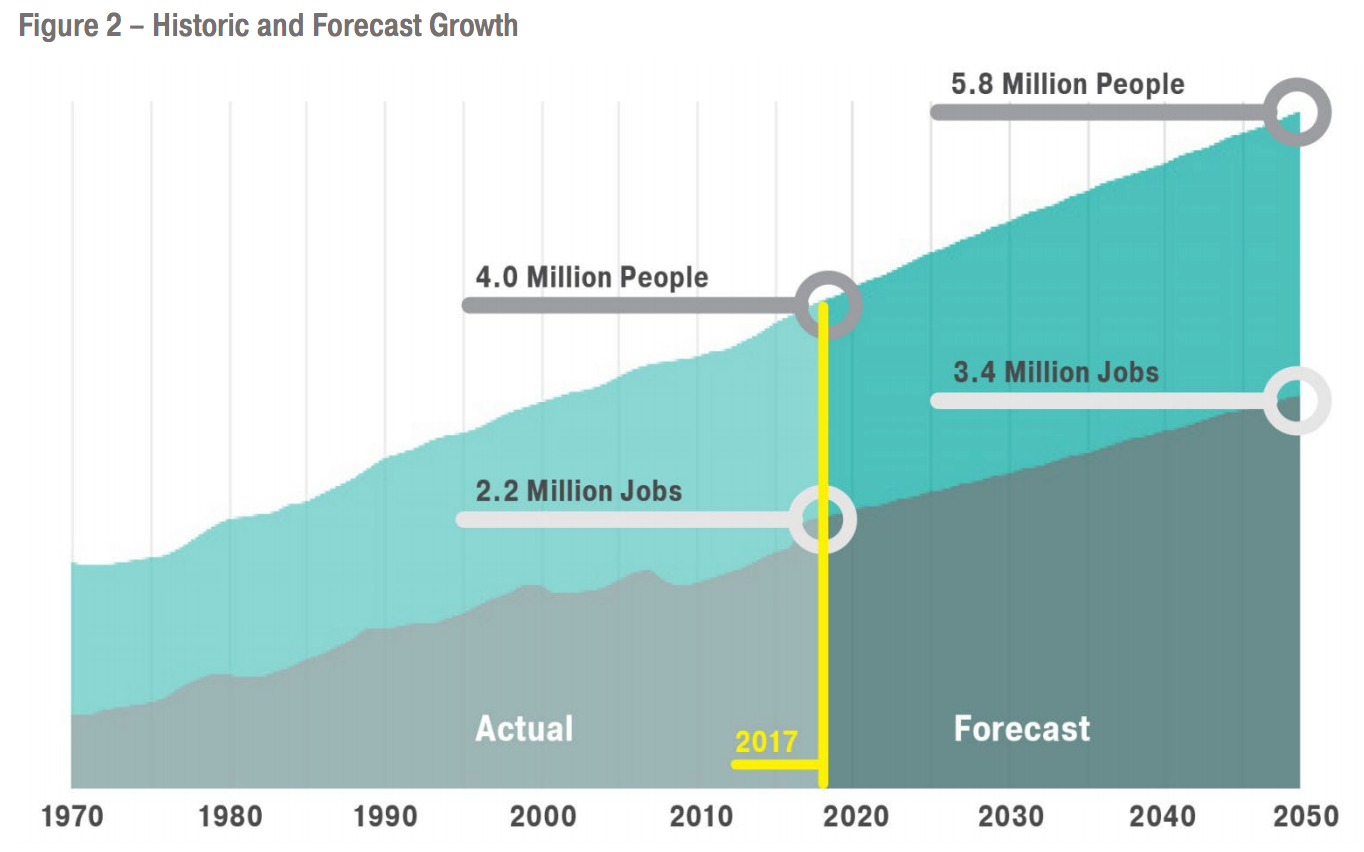
The Puget Sound Regional Council (PSRC) has put out a draft proposal for VISION 2050, the multi-county policy document to guide regional growth through the Year 2050. The VISION 2050 plan is the next permutation of VISION 2040, the current regional long-range growth plan, stipulating how population and jobs should be allocated by geography type in the counties of King, Pierce, Snohomish, and Kitsap. By 2050, the region is projected to grow by another 1.8 million residents and 1.2 million jobs.
The regional growth plan provides a broad framework on how counties and cities should address a variety of planning topics, such as housing, the environment, economic development, infrastructure, transportation, development patterns, open space, and climate change. This ultimately affects how local land use decisions are made through designation of Urban Growth Areas, zoning, and development regulations as well as how the PSRC allocates pass-through funding for things like local and regional transportation investments.
Through mid-month, the PSRC is taking public comment on the draft proposal.
A growth plan centered around transit
In the draft proposal, the PSRC is moving forward with a plan that most closely resembles the “Transit Focused Growth Alternative” evaluated in the Draft Supplemental Environmental Impact Statement issued earlier this year. Generally speaking, that alternative performed best across different environmental topics and metrics than the “Stay The Course Alternative” and “Reset Urban Growth Alternative”. The Regional Growth Strategy in the plan would allocate 65% of regional population growth and 75% of regional job growth within Regional Growth Centers, Manufacturing/Industrial Centers, and near high-capacity transit. Only a small proportion of growth would be allocated to occur outside of Urban Growth Areas.
Urban geography terminology primer
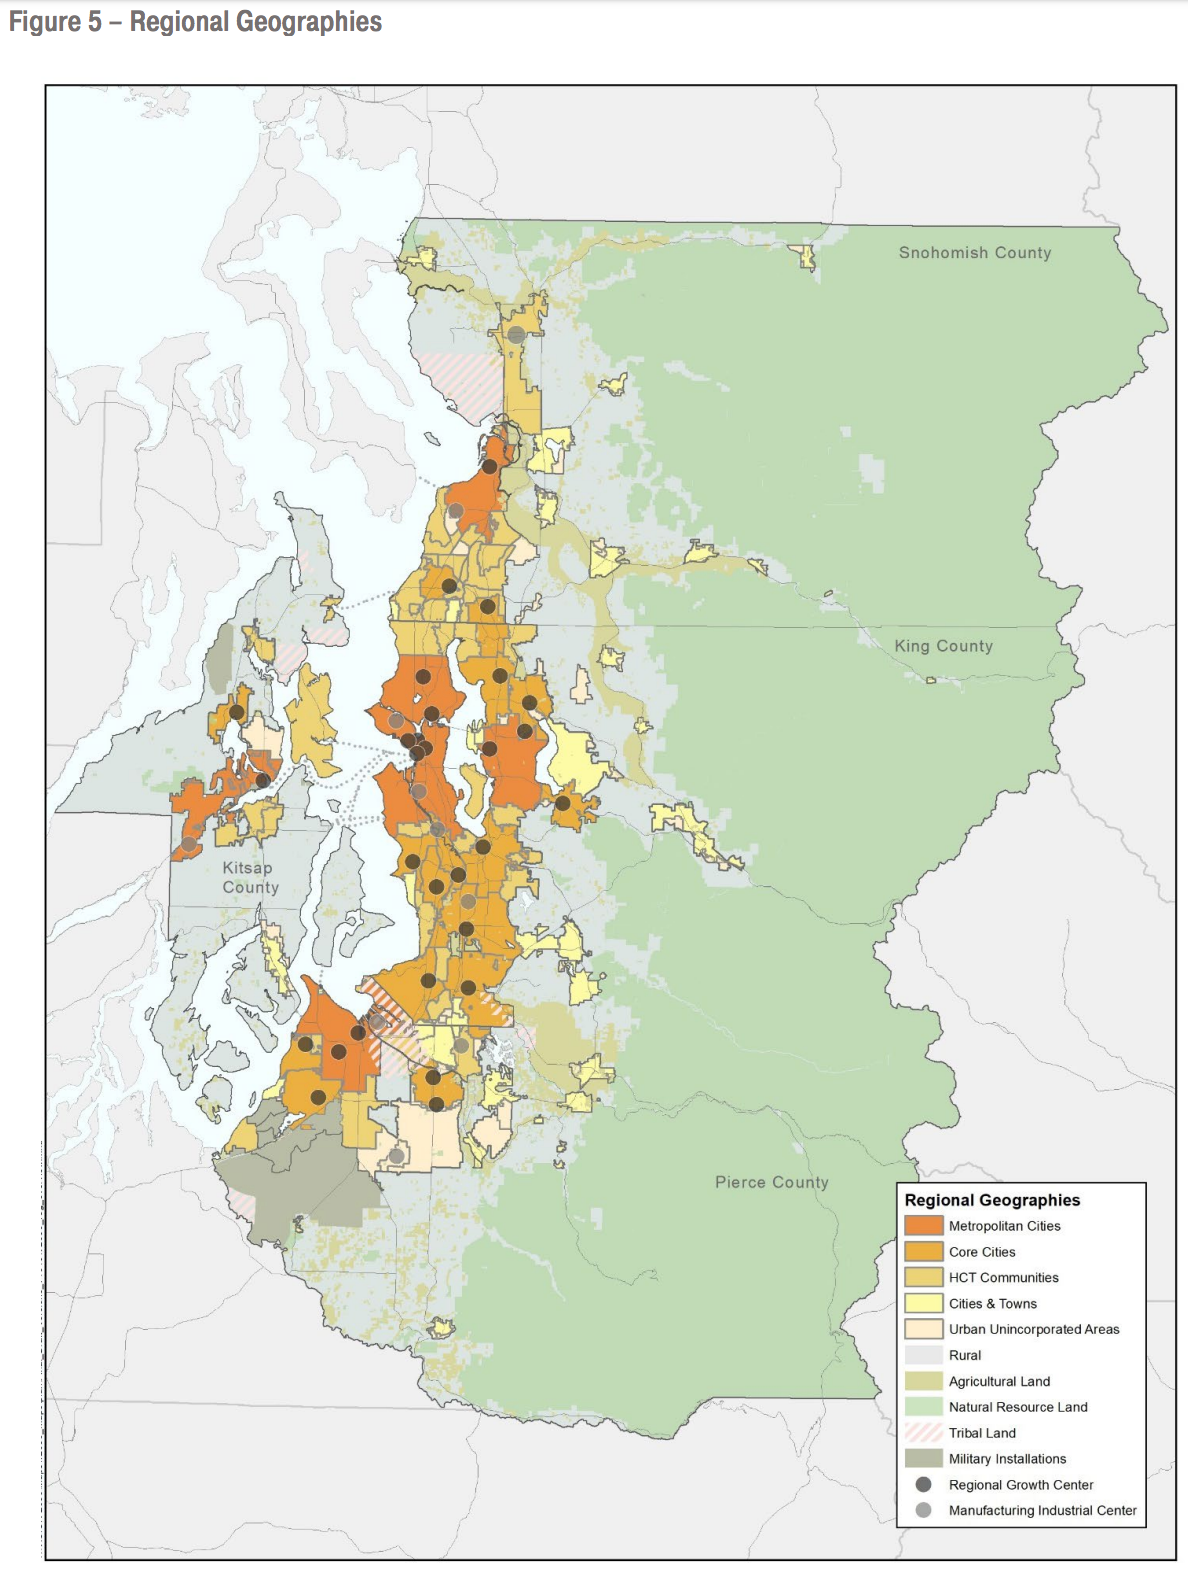
The draft proposal consists of five urban geography types, including (from most intensive to least least intensive):
- Metropolitan Cities (e.g., Seattle, Tacoma, and Everett) which encompass five cities and 230 square miles;
- Core Cities (e.g., Kent, Lynnwood, and Silverdale) which encompass 16 cities and 255 square miles;
- High Capacity Transit Communities (e.g., North Highline, Lynnwood Municipal Urban Growth Area, and Federal Way Potential Annexation Area) which encompass 32 areas and 246 square miles;
- Cities and Towns (e.g., Algona, Duvall, Sultan, and Bonney Lake) which encompass 42 cities and towns and 140 square miles; and
- Urban Unincorporated Areas (located in all for counties) which encompass 134 square miles.
Within the urban geographies, the PSRC recognizes two flavors of Regional Growth Centers, two flavors of Manufacturing/Industrial Centers, and eventually two flavors of countywide centers. These could be added throughout the life of the plan due to a new framework adopted last year.
The draft proposal also includes four non-urban and special geographies, including:
- Rural Areas (located in all for counties) which encompass 1,494 square miles and represent 24% of the region’s land area;
- Natural Resource Lands (located in all for counties) which encompass 3,829 square miles and represent 61% of the region’s land area;
- Major Military Installations (e.g., Joint Base Lewis-McChord) which encompass four installations and 122 square miles; and
- Tribal Lands (e.g, Muckleshoot Indian Reservation, Tulalip Indian Reservation, and Puyallup Indian Reservation) which encompass nine reservations and 93 square miles.
To get a better sense of how this all shakes out, the PSRC has an interactive map that highlights each of the regional geographies.
While the draft plan covers a range of policy areas, the projected allocation of how growth would be apportioned across the region is one of the more interesting aspects and certainly of critical importance to achieving regional sustainability.
How growth would be allocated by geography
The proposal specifies how growth would be divvied up by geography for both population and jobs. Generally speaking, the bulk of growth is slated for Metropolitan Cities followed by Core Cities and High Capacity Transit Communities. How that breaks down by county, however, differs greatly.
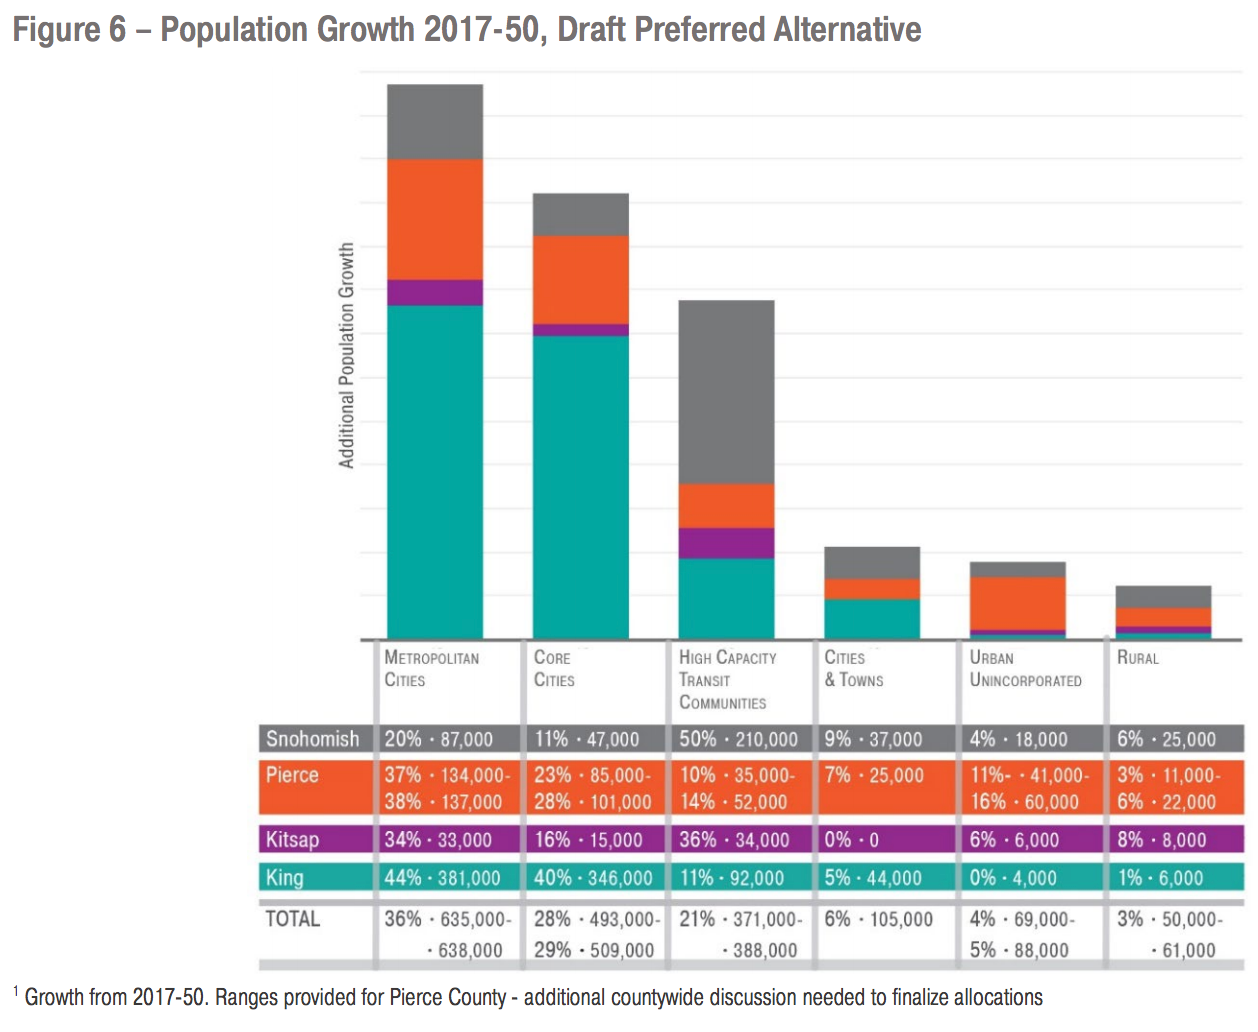
For population growth, the four counties would allocate new residents by geography as follows:
- King County. The largest amount of population growth would be allocated to King County with 870,000 new residents. That represents nearly half of all new regional population by 2050. Approximately 44% of the county’s population growth is slated to occur in Metropolitan Cities with Seattle continuing to lead the way for that category. Another 40% of population growth in the county would occur in Core Cities followed by 11% in High Capacity Transit Communities. Since there are very few unincorporated Urban Growth Areas remaining in the county, less than 1% of population growth would happen in Urban Unincorporated geographies while higher rates would occur in other counties. Rural areas would continue to see a trickle of population growth at about 1%. Cities and Towns would see a meager 5% population growth.
- Snohomish County. The second largest amount of population growth would be allocated to Snohomish County with 424,000 new residents. That represents nearly a quarter of all new regional population by 2050. Approximately 50% of the county’s population growth is slated to occur in High Capacity Transit Communities, some of which include cities like Edmonds and Mountlake Terrace and Urban Unincorporated areas of Lynnwood and Mukilteo. Another 20% of population growth in the county would occur in the Metropolitan Cities (i.e., Everett) followed by 11% in Core Cities (i.e., Lynnwood). Since there are very few unincorporated Urban Growth Areas of the county not falling into the High Capacity Transit Communities geography, only 4% of population growth would happen in those areas. Despite a lower rate than VISION 2040, Rural areas would still see a relatively high rate of population growth at about 6% or 25,000 new residents which is highest among all counties. Cities and Towns would see 9% population growth.
- Pierce County. The third largest amount of population growth would be allocated to Pierce County with up to 397,000 new residents, although that number could be lower as allocation numbers are still being debated. Approximately 37% to 38% of the county’s population growth is slated to occur in Metropolitan Cities (i.e., Tacoma). Another 23% to 28% of population growth in the county would occur in Core Cities (i.e., Puyallup, Lakewood, and University Place) followed by 10% to 14% in High Capacity Transit Communities. For Urban Unincorporated areas, approximately 11% to 16% of population growth could be allocated to those geographies. This is somewhat reflective of the fact that the county has drawn those areas so large and has been very unsuccessful in pushing annexation of them. Cities and Towns would also see 7% population growth while Rural areas would range from 3% to 6%–less than Snohomish County.
- Kitstap County. The smallest of the four counties, Kitsap County would be allocated 96,000 new residents. Approximately 34% of population growth would be targeted for Metropolitan Cities (i.e., Bremerton) and 36% to High Capacity Transit Communities (e.g., Bainbridge Island and Port Orchard). Another 16% of population growth would be allocated to Core Cities (i.e., Silverdale), 6% to Urban Unincorporated areas, and 8% to Rural areas–the largest proportion of the four counties.
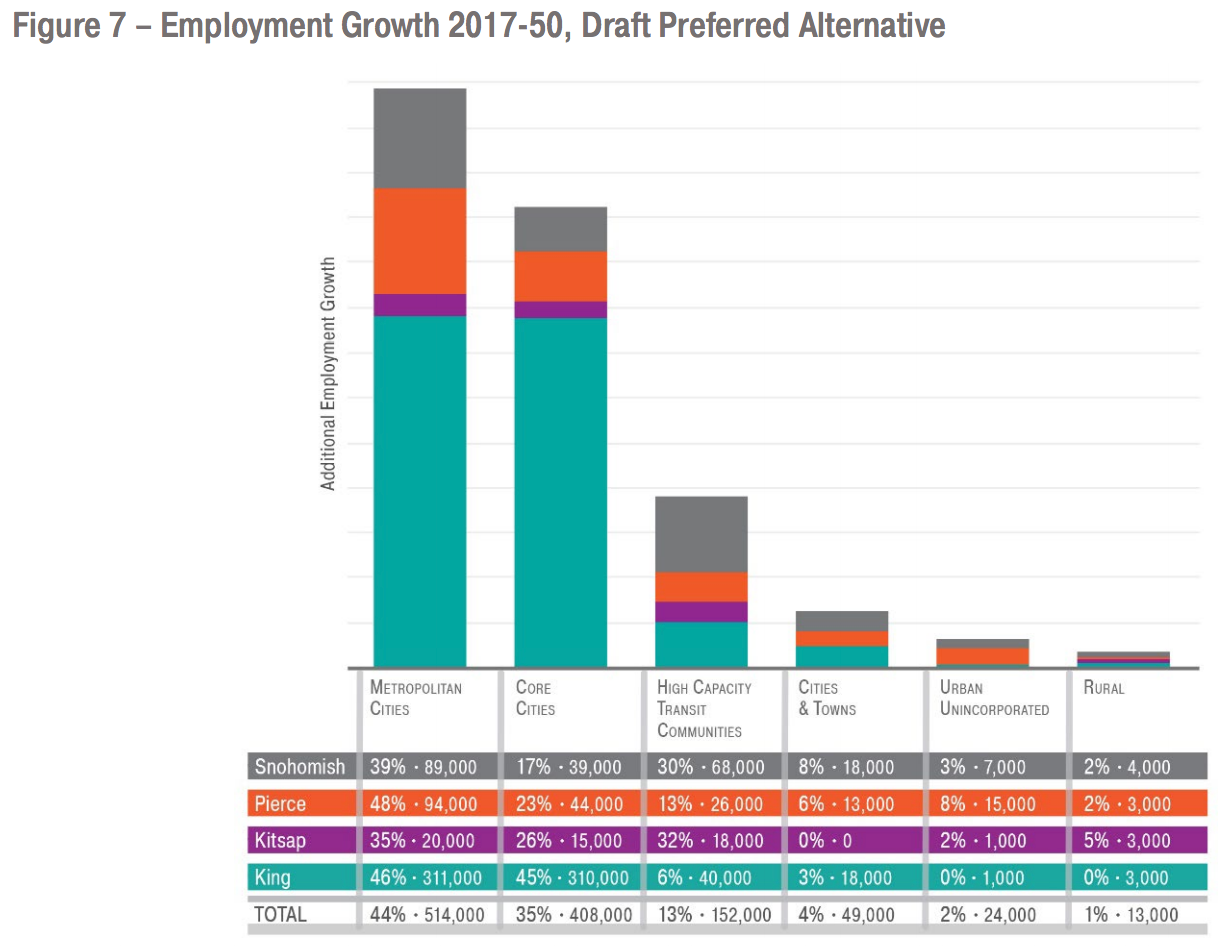
For job growth, the four counties would allocate new residents by geography as follows:
- King County. The largest amount of job growth would be allocated to King County with 683,000 new jobs. That represents more than half of all new regional jobs by 2050. Approximately 46% of the county’s job growth is slated to occur in Metropolitan Cities (i.e., Seattle and Bellevue). Another 45% of job growth in the county would occur in Core Cities followed by 6% in High Capacity Transit Communities. Less than 1% of job growth would happen in Urban Unincorporated (1,000 jobs) and Rural (3,000 jobs) geographies–with the latter producing more.
- Snohomish County. The second largest amount of job growth would be allocated to Snohomish County with 225,000 new jobs. Approximately 39% of the county’s job growth is slated to occur in Metropolitan Cities (i.e., Everett). Another 30% of job growth in the county would occur in High Capacity Transit Communities followed by 17% in Core Cities. Cities and Towns would receive 8% job growth while Urban Unincorporated areas would receive 3% job growth. A small sliver at 2% job growth would be allocated to Rural areas.
- Pierce County. The third largest amount of job growth would be allocated to Pierce County with 195,000 new jobs. Approximately 48% of the county’s job growth is slated to occur in Metropolitan Cities (i.e., Tacoma). Another 23% of job growth in the county would occur in Core Cities followed by 13% in High Capacity Transit Communities. Cities and Towns would receive 6% job growth while Urban Unincorporated areas would receive 8% job growth. A small sliver at 2% job growth would be allocated to Rural areas.
- Kitstap County. The smallest of the four counties, Kitsap County would be allocated 57,000 new jobs. Approximately 35% of the county’s job growth is slated to occur in Metropolitan Cities (i.e., Bremerton). Another 32% of job growth in the county would occur in High Capacity Transit Communities followed by 13% in Core Cities. Only 2% of job growth would be located in Urban Unincorporated areas while a larger 5% job growth would be allocated to Rural areas.
Next steps
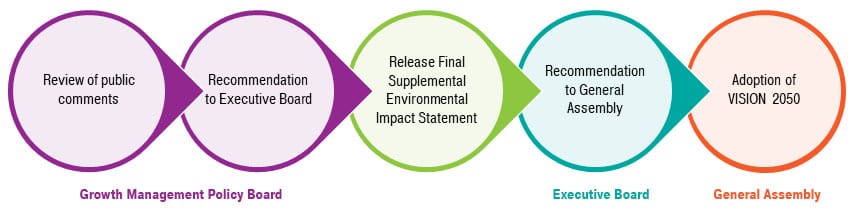
Public comment is open through September 16th and can be provided through the online open house. A final plan will be developed in the fall going through the Growth Management Policy Board and onward to the Executive Board. In the spring of 2020, the PSRC General Assembly is poised to adopt a finalized version of VISION 2050.