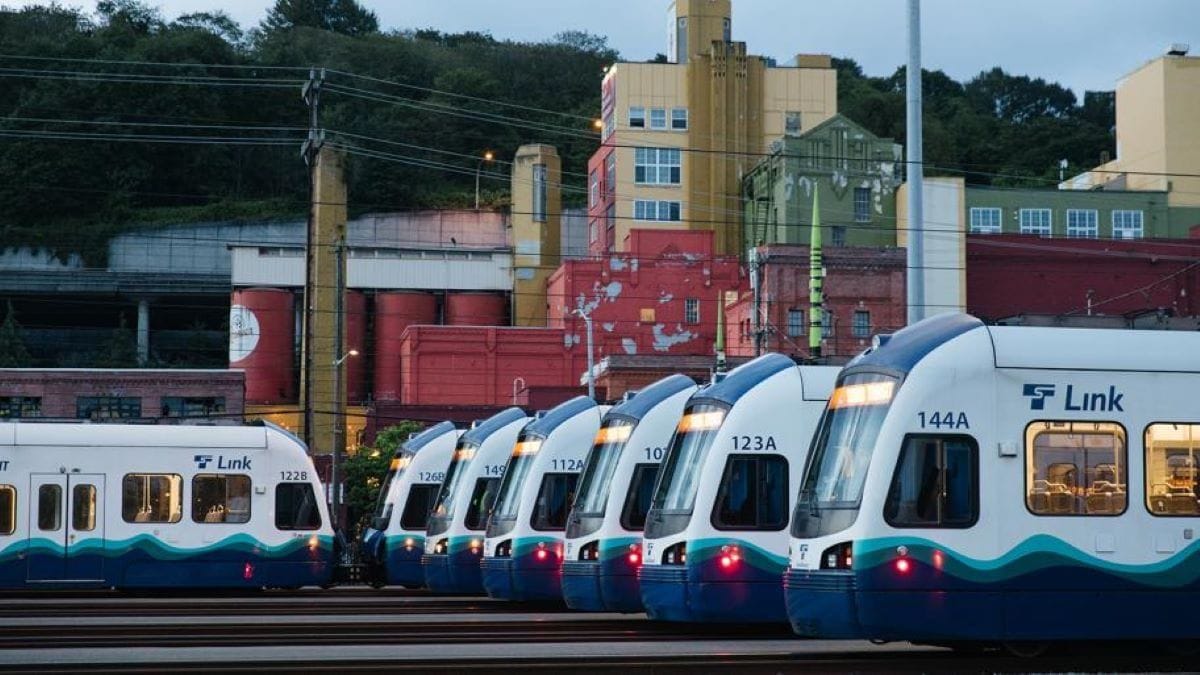
Sound Transit is facing a significant budget issue, with a roughly 10-billion-dollar budget gap in its planned light rail expansions, even after cuts and delays announced in May. Ballard Link faces the largest expected budget shortfall, but one revenue tool could help get the project back on track: a value capture strategy using tax-increment financing (TIF).
Sound Transit 3 (ST3), approved by voters in 2016, is meant to deliver the West Seattle Link Extension, the Ballard Link Extension, the 4 Line light rail from Issaquah to South Kirkland, and more. The budget rebalancing in May required that Sound Transit make a lot of significant concessions, most notably terminating the Ballard line at Seattle Center, tabling three stations indefinitely, including one of the project’s highest projected ridership stations: Ballard.
Earlier this month, Sound Transit revealed that 2042 was its best case scenario opening date for Ballard Link, while the three deferred stations would slip to around 2060 without inventions to cut costs and find new revenue.
Value capture taxes function by making a very powerful inference. When rapid transit is built, land around the stations becomes more valuable, often dramatically more so. In a normal transit-building scenario, the additional tax collected from the land value increase goes to the same services that they typically would have. More money for the City and County budget, more money for the school district, and more…, all made possible by the train. Increased property value and tax revenue that transit creates is clearly a good thing for local governments, and is yet another reason that building rapid transit is an amazing decision.
Tax-increment financing (TIF) districts
A few different types of value capture taxes exist, but the main one I’m focusing on is called tax increment financing, often referred to as TIF. Tax increment financing operates by taking out a large loan, ‘freezing’ the property values at a certain number and point in time, and then allocating any additional tax gained from an increase in property value to pay back the loan that funded the project.
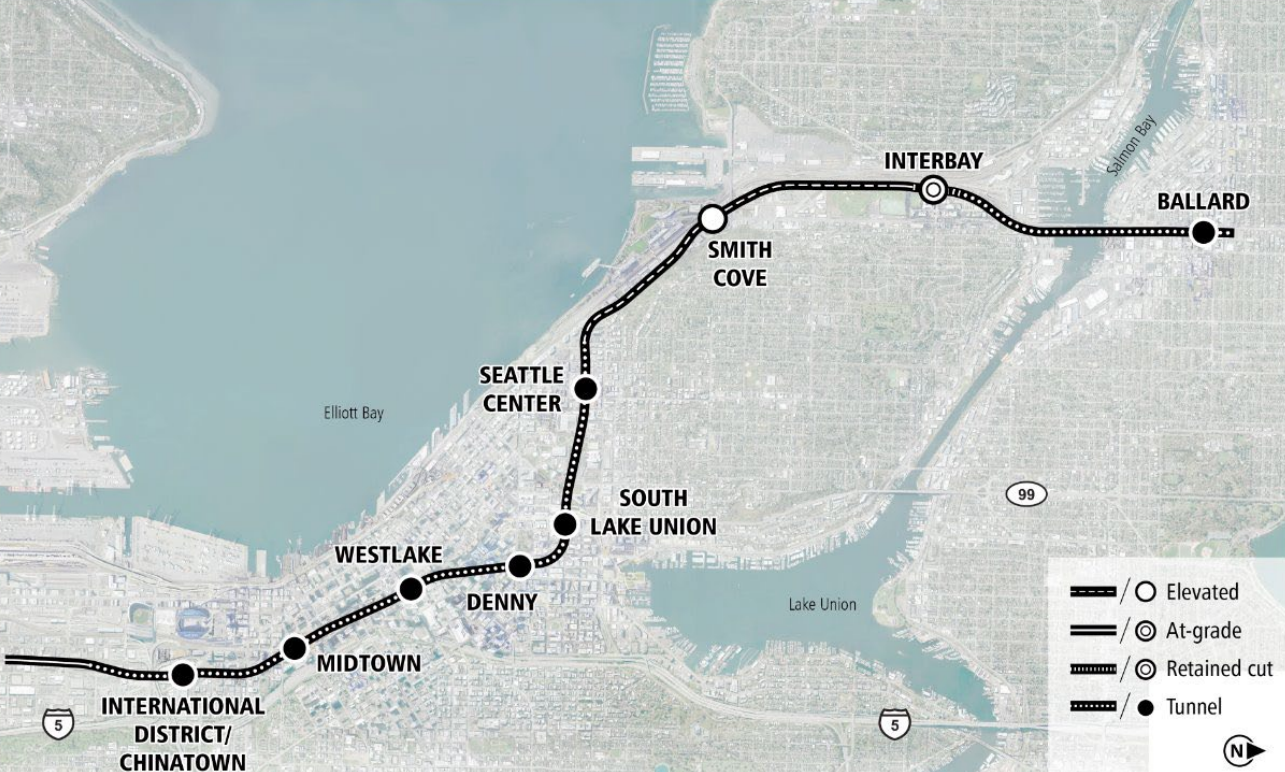
The Ballard Link Extension is in serious jeopardy. If the extension all the way to 15th and Market Street doesn’t happen, or is delayed until the 2060s as feared, then there will be billions of dollars in property tax income (among many other significant benefits) that will vanish into thin air. This would be a truly historic fumble. Instead, Sound Transit can work with the city of Seattle to capture future property value increase!
That increased value will literally not exist if the project doesn’t happen. The increased value will exist if the project does happen.
Please note that for this article, I am speaking exclusively about land value, not the improved value upon the land. Read my land value tax article for more about that distinction. Also note that improvement value around the rapid transit stations, unaffected by a value capture tax, typically increases substantially. This creates tax revenue for the city that usually well outpaces the value lost to the financing vehicle.
See this graph below to visualize the different aspects of a TIF district
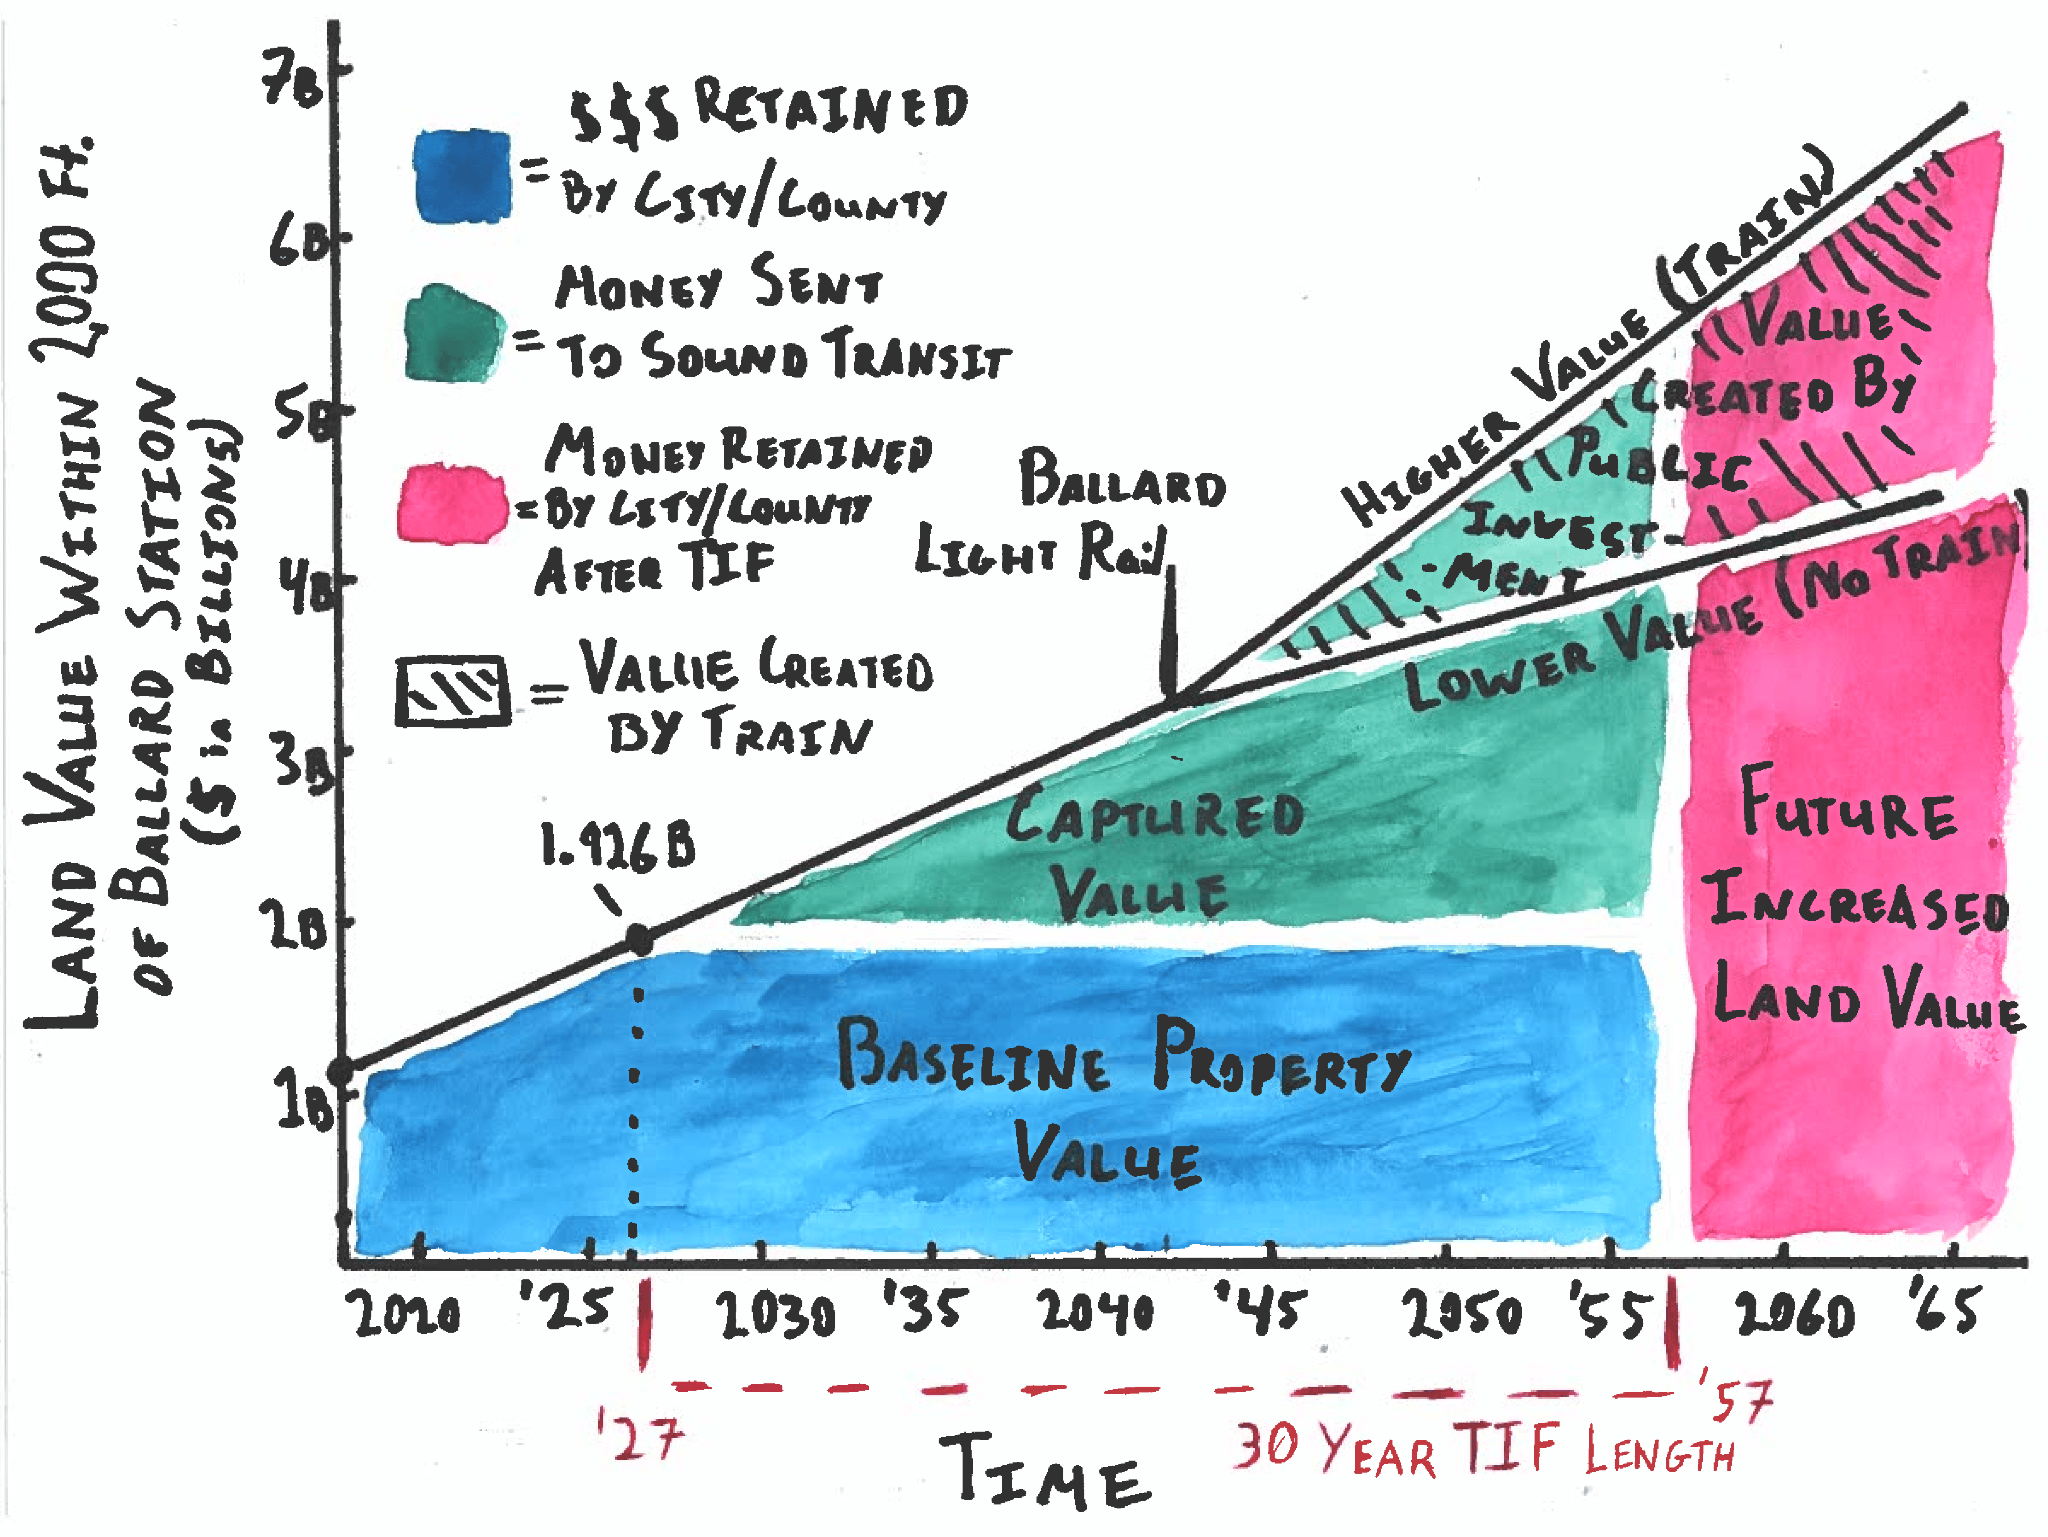
The image above is illustrative and is meant to communicate the general idea of a TIF, and not to calculate exact numbers. The 30 year TIF term is not set in stone and is often adjusted based on the amount of money the TIF zone brings in. The $1.077 billion in 2018 and $1.926 billion in 2027 are both real data points representing the land value within 2,000 feet of 15th and Market. All other data seen are projected.
Elsewhere in King County
Value capture taxes are not novel in our region. We can look towards a recent example of a local improvement district (LID) funding a prominent Seattle victory: Waterfront Park. Completed in 2025, Waterfront Park is the culmination of the project started long ago with the digging of the SR 99 tunnel and the teardown of the Alaskan Way Viaduct. This has become an amazing part of our city and was recently on display during the World Cup. Without taxing the district directly benefitting the most, the Waterfront Park project may not have been possible, and the benefitting properties would not have found the same increase in value to their land.

LIDs are similar to TIFs, but directly tax property owners in the region rather than ‘capturing’ a portion of the increased tax revenue like a TIF does. Read about Seattle’s Waterfront Park LID here, and LIDs in general here.
A second example comes from our neighbors on the other side of the 2 Line: Bellevue. In an effort to fund the Grand Connection, five different local government authorities, including Sound Transit, approved the TIF plan for this project. King County Councilmember Claudia Balducci said she hopes this sets a precedent for other parts of King County to use this funding mechanism. The Grand Connection, if built, will provide a lot of value to the surrounding areas. Read all about this project in The Urbanist.
Now for some light data analysis
The area around 15th and Market in Ballard is already valuable land, but will become much more so if and when the light rail is completed. The area today features a huge amount of car activity and space dedicated to the personal automobile, including large parking lots at Walgreens and Safeway, a gas station, and the gigantic streets themselves. A completed light rail line would allow that area to enjoy far more economic activity.
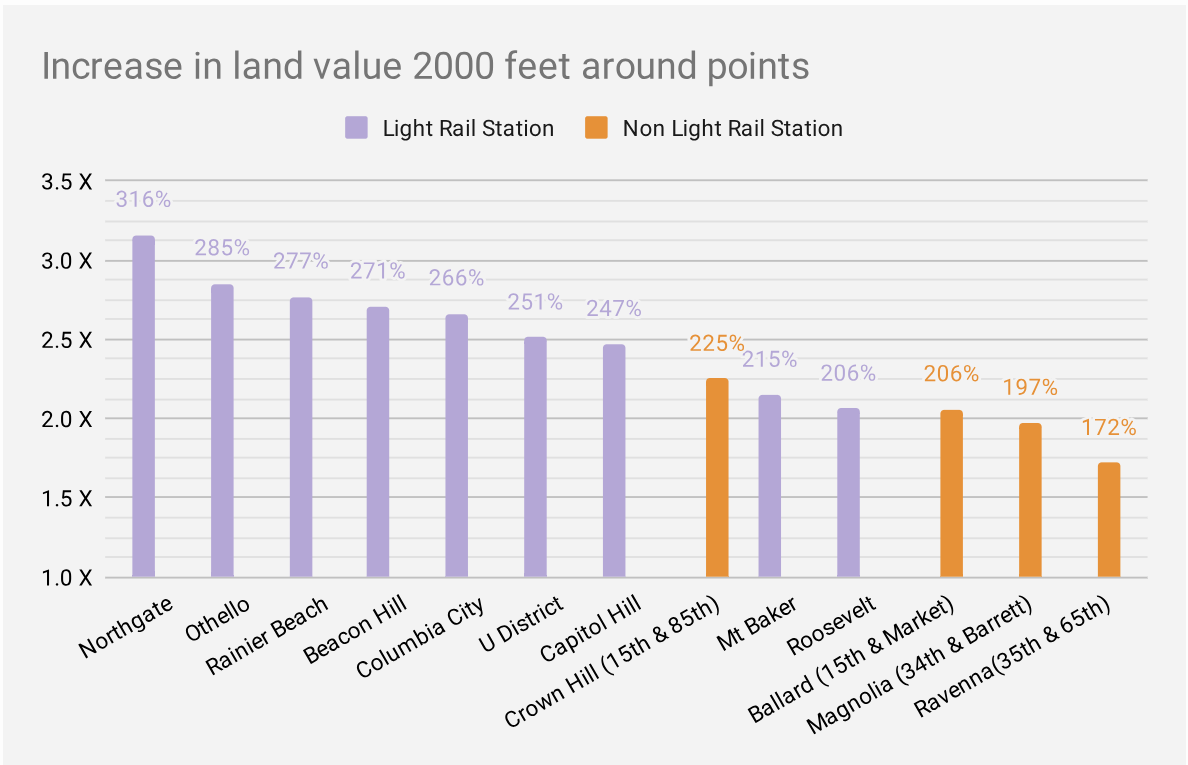
For this data analysis and visualization, I took data from the King County Assessor, who publishes an extensive data download page with property tax information going back over 15 years. For this analysis I used the most up to date data, 2027, to compare with data from 2018. Check out this chart showing the mean increase in land value in the 2000 feet around various light rail stations and non light rail stations. Due to their differences in land use patterns I chose to exclude downtown and SoDo light rail stations from this analysis. Downtown sports high density, whereas the SoDo stations are surrounded by lots of industrial land. These areas are rather different from the nine station areas studied, which primarily have medium density and mixed land uses, making them relatively comparable.
Below is a bar graph showing the amount that land around various points has increased in value over the past nine years. Note the clear increase around the light rail stations. Correlation or causation?
Now let’s visualize some of those numbers. First, take a look at this map of the entire city, aggregated into hexagons, showing the median increase from 2018 to present in that hexagon. You can almost see the path of the light rail. The northern stations (University District, Roosevelt, and Northgate) have only been open since 2021, but the stations in South Seattle all have had time to reap the benefits of the train access and are significantly more valuable than they were in 2018.
Land Value 2018 vs 2027, Aggregated into Hexagons
Now take a look at the map below, showing individual parcels in the 2,000 foot radius around their respective center points.
Nine light rail station areas and four notable non light rail areas (2,000 foot radius)
Note that in the nine years between the 2018 and 2027 assessments, some parcels have been divided and new ones created in their place. Consequently, a direct 1 to 1 comparison is not possible in those instances. For this reason, as well as certain public property not being evaluated in the same way (such as public universities and parks), not all parcels will show in these maps. This applies, albeit less frequently, to the aggregated hexagon maps.
Additionally, you may have noticed some sections where there are groups of parcels that all uniformly increased in value, such as in the eastern portion of the Ballard circle. This is usually caused by upzoning which makes the land instantly more valuable, as more types/density can be added to those lots.
Directly applied to Ballard, with some math
The land in a 2,000-foot radius around Ballard Station (15th and Market) is currently worth close to $2 billion ($1,926,924,400 to be exact). Seattle’s property tax rate is just shy of 1% (often denoted as $10 per $1000 in value), meaning that the land around Ballard Station brings in about $19 million.
Note that the 2,000 foot radius chosen for this study is an arbitrary size within the typical range and not the letter of the law. TIF areas have no uniform radius and are often not circles at all. If this were to be implemented, the powers that be would decide which properties are within the area most affected by the new station and include them in the TIF district.
If a TIF district were to be made for those properties within a 2,000-foot radius, and land value grows 250% in nine years, as could be reasonably expected based on value growth surrounding light rail stations since 2017 (see initial bar graph), we can translate that to 10% per year. If that 10% per year is ‘captured’ and all the growth goes to funding ST3, a TIF district would yield $114 million in its first decade, $718 million in its first 20 years and a generous $2.59 billion in a 30-year period. $2.59 billion is a significant portion of the $7 billion to $9 billion funding gap facing the Ballard Link Extension.
This $2.59 billion over 30 years at 10% value growth per year may not be realistic. There are a huge amount of variables at play here, such as the radius of the financing zone, the percentage of the value increase allocated to Sound Transit, the increase in land value and more. Also keep in mind that this was calculated for just one station, but could be applied to many more stations, such as Interbay, Smith Cove, the extremely high land value Denny Station, and even stations on the West Seattle and 4 Line stations at Eastgate and Central Issaquah.
A value capture tax could find a lot of money for transit that otherwise would not exist. Ballard Station will provide staggering positive externalities to the community, and if the agency executing the project can capture just some of them, maybe the train will actually see the light at the end of the tunnel.
Thanks for reading. You can check out my code for the project here, and please don’t hesitate to reach out with your thoughts at aaron.m.schechter@gmail.com.
This article was adapted from a version that first appeared on Aaron Schechter’s blog.
 Aaron Schechter